Xerox 2015 Annual Report Download - page 54
Download and view the complete annual report
Please find page 54 of the 2015 Xerox annual report below. You can navigate through the pages in the report by either clicking on the pages listed below, or by using the keyword search tool below to find specific information within the annual report.-
 1
1 -
2
-
3
-
4
-
5
-
6
-
7
-
8
-
9
-
10
-
11
-
12
-
13
-
14
-
15
-
16
-
17
-
18
-
19
-
20
-
21
-
22
-
23
-
24
-
25
-
26
-
27
-
28
-
29
-
30
-
31
-
32
-
33
-
34
-
35
-
36
-
37
-
38
-
39
-
40
-
41
-
42
-
43
-
 44
44 -
 45
45 -
 46
46 -
 47
47 -
 48
48 -
 49
49 -
 50
50 -
 51
51 -
 52
52 -
 53
53 -
 54
54 -
 55
55 -
 56
56 -
 57
57 -
 58
58 -
 59
59 -
 60
60 -
 61
61 -
 62
62 -
 63
63 -
 64
64 -
65
-
66
-
67
-
68
-
69
-
70
-
71
-
72
-
73
-
74
-
75
-
76
-
77
-
78
-
79
-
80
-
81
-
82
-
83
-
84
-
85
-
86
-
87
-
88
-
89
-
90
-
91
-
92
-
93
-
94
-
95
-
96
-
97
-
98
-
99
-
100
-
101
-
102
-
103
-
104
-
105
-
106
-
107
-
108
-
109
-
110
-
111
-
112
-
113
-
114
-
115
-
116
-
117
-
118
-
119
-
120
-
121
-
122
-
123
-
124
-
125
-
126
-
127
-
128
-
129
-
130
-
131
-
132
-
133
-
134
-
135
-
136
-
137
-
138
-
139
-
140
-
141
-
142
-
143
-
144
-
145
-
146
-
147
-
148
-
149
-
150
-
151
-
152
-
153
-
154
-
155
-
156
-
157
-
158
 |
 |

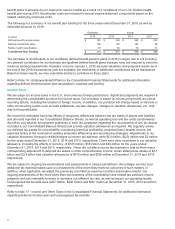
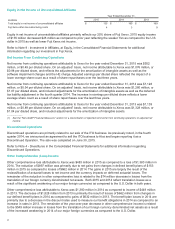
Liquidity section as well as Note 6 - Finance Receivables, Net in the Consolidated Financial Statements for
additional information.
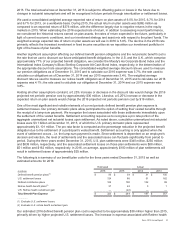
• Equipment sales revenue is reported primarily within our Document Technology segment and the Document
Outsourcing business within our Services segment. Equipment sales revenue decreased 10% from the prior
year, including a 4-percentage point negative impact from currency. The constant currency decline was driven
by developing markets with the remainder reflecting lower high-end and OEM sales as well as overall price
declines that continue to be within our historical range of 5% to 10%.These areas of decline were partially offset
by DO equipment sales growth.
Revenue 2014
Total revenues decreased 2% compared to the prior year with no impact from currency. Total revenues included the
following:
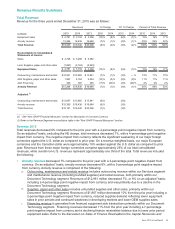
• Annuity revenue decreased 1% compared to the prior year with no impact from currency. Annuity revenue is
comprised of the following:
Outsourcing, maintenance and rentals revenue includes outsourcing revenue within our Services segment
and maintenance revenue (including bundled supplies) and rental revenue, both primarily within our
Document Technology segment. Revenues of $13,865 million decreased 1% from the prior year with a 1-
percentage point negative impact from currency. The decrease was due to a decline in the Document
Technology segment partially offset by growth in outsourcing revenue within our Services segment.
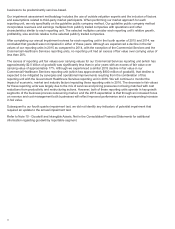
Supplies, paper and other sales includes unbundled supplies and other sales, primarily within our
Document Technology segment. Revenues of $2,184 million decreased 2% from the prior year with no
impact from currency. The decrease was primarily driven by moderately lower supplies demand and a
decline in other sales revenue.
Financing revenue is generated from financed sale transactions primarily within our Document Technology
segment. Financing revenues decreased 20% from the prior year due primarily to $40 million in pre-tax
gains on finance receivable sales in 2013 as well as a lower finance receivable balance mostly as a result
of prior period sales of finance receivables and lower originations due to decreased equipment sales. Refer
to the discussion on Sales of Finance Receivable in the "Capital Resources and Liquidity" section as well as
Note 6 - Finance Receivables, Net in the Consolidated Financial Statements for additional information.
• Equipment sales revenue is reported primarily within our Document Technology segment and the Document
Outsourcing business within our Services segment. Equipment sales revenue decreased 8% from the prior
year, including a 1-percentage point negative impact from currency. Lower installs across the majority of our
product groupings, lower sales in entry products due to product launch timing and overall price declines that
were at the low-end of our historical 5% to 10% range contributed to the decline. Equipment sales were also
impacted by lower sales in developing markets, and particularly lower sales in Russia due to economic
instability.
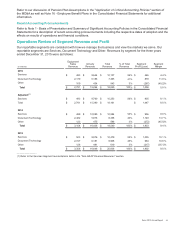
An analysis of the change in revenue for each business segment is included in the “Operations Review of Segment
Revenue and Profit” section.
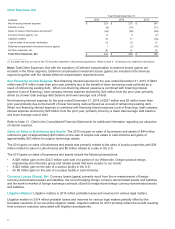
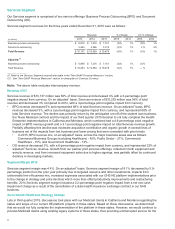
Costs, Expenses and Other Income
Summary of Key Financial Ratios
Year Ended December 31, Change
2015 2014 2013 2015 B/(W) 2014 B/(W)
2015
Adjusted(1)
2015
Adjusted(1)
B/(W) 2014
Total Gross Margin 29.2% 32.0% 32.4% (2.8) pts (0.4) pts 31.1%(0.9) pts
RD&E as a % of Revenue 3.1% 3.0% 3.0% (0.1) pts — pts 3.1% (0.1) pts
SAG as a % of Revenue 19.7% 19.4% 20.4% (0.3) pts 1.0 pts 19.6%(0.2) pts
Operating Margin(1) NM 9.6% 9.0% NM 0.6 pts 8.4% (1.2) pts
Pre-tax Income Margin 2.3% 6.2% 6.2% (3.9) pts — pts N/A N/A
_______________
(1) Refer to Key Financial Ratios reconciliation table in the "Non-GAAP Financial Measures" section.
37