Xerox 2015 Annual Report Download - page 45
Download and view the complete annual report
Please find page 45 of the 2015 Xerox annual report below. You can navigate through the pages in the report by either clicking on the pages listed below, or by using the keyword search tool below to find specific information within the annual report.-
 1
1 -
2
-
3
-
4
-
5
-
6
-
7
-
8
-
9
-
10
-
11
-
12
-
13
-
14
-
15
-
16
-
17
-
18
-
19
-
20
-
21
-
22
-
23
-
24
-
25
-
26
-
27
-
28
-
29
-
30
-
31
-
32
-
33
-
34
-
 35
35 -
 36
36 -
 37
37 -
 38
38 -
 39
39 -
 40
40 -
 41
41 -
 42
42 -
 43
43 -
 44
44 -
 45
45 -
 46
46 -
 47
47 -
 48
48 -
 49
49 -
 50
50 -
 51
51 -
 52
52 -
 53
53 -
 54
54 -
 55
55 -
56
-
57
-
58
-
59
-
60
-
61
-
62
-
63
-
64
-
65
-
66
-
67
-
68
-
69
-
70
-
71
-
72
-
73
-
74
-
75
-
76
-
77
-
78
-
79
-
80
-
81
-
82
-
83
-
84
-
85
-
86
-
87
-
88
-
89
-
90
-
91
-
92
-
93
-
94
-
95
-
96
-
97
-
98
-
99
-
100
-
101
-
102
-
103
-
104
-
105
-
106
-
107
-
108
-
109
-
110
-
111
-
112
-
113
-
114
-
115
-
116
-
117
-
118
-
119
-
120
-
121
-
122
-
123
-
124
-
125
-
126
-
127
-
128
-
129
-
130
-
131
-
132
-
133
-
134
-
135
-
136
-
137
-
138
-
139
-
140
-
141
-
142
-
143
-
144
-
145
-
146
-
147
-
148
-
149
-
150
-
151
-
152
-
153
-
154
-
155
-
156
-
157
-
158
 |
 |
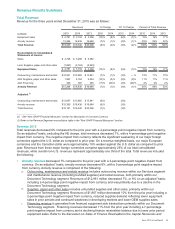
lower supplies demand as well as continued price and page declines. Document Technology segment margin of
11.9% decreased 1.8-percentage points from 2014, reflecting unfavorable product mix and price declines, within our
historical range, and an increase in pension expense partially offset by restructuring and productivity benefits.
2015 Net income from continuing operations attributable to Xerox was $552 million and included the $241 million
after-tax HE charge and $90 million after-tax GHS software impairment charges as well as $193 million of after-tax
amortization of intangible assets. Net income from continuing operations attributable to Xerox for 2014 was $1,128
million and included $196 million of after-tax amortization of intangible assets. The decrease in net income, after
consideration of the noted charges, is primarily due to the profit decline in both the Services and Document
Technology segments.
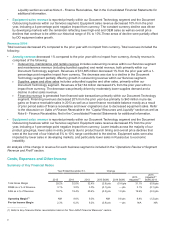
Cash flow from operations was $1.6 billion in 2015 as compared to $2.1 billion in 2014. The decrease in operating
cash flow was primarily due to lower earnings and the elimination of cash flows from the divested ITO business.
Cash provided by investing activities of $508 million primarily reflects net proceeds from the sale of the ITO
business of approximately $930 million partially offset by capital expenditures of $342 million and acquisitions of
$210 million. Cash used in financing activities was $2.1 billion, reflecting $1.3 billion for share repurchases, $370
million of net payments on debt and $326 million for dividends.
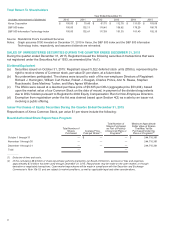
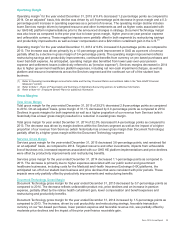
2016 Outlook
We expect total revenues to decline 2 to 4% in 2016, excluding the impact of currency. At mid January 2016
exchange rates, we expect currency to have about a 1 to 2 percentage point negative impact on total revenues in
2016, reflecting the continued weakening of our major foreign currencies against the U.S. dollar as compared to
prior year. Earnings in 2016 are expected to reflect margin improvements in the Services segment and a Document
Technology margin generally consistent with 2015. Refer to the "2016 Segment Reporting Change" section for a
discussion of planned changes in the measurement of segment revenues and profits in 2016. The discussion below
reflects those changes and the "2016 Segment Reporting Change" section includes a summary of revised segment
results for 2015 on the new basis for comparison purposes.
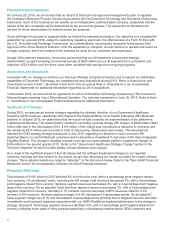
In our Services business, we expect flat to 3% revenue growth, excluding the impact of currency, with revenue
growth improving through the year driven by continued growth in signings. Services margins are expected to
improve and be in the range of 8 to 9.5% in 2016 as we continue to focus on productivity and cost improvements,
capturing additional efficiencies, including streamlining and automating more of our service delivery capabilities, and
continued improvements to our business mix with a greater proportion of revenue from higher value offerings.
In our Document Technology business, we expect revenue to decline 5 to 7%, excluding the impact of currency, as
we continue to face secular declines in these markets. We expect to offset these expected declines through
continued cost management as well as the benefits from productivity and restructuring actions. 2016 margins in
Document Technology are expected to be in the range of 12 to 14%, in line with 2015.
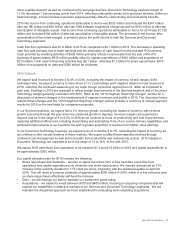
We expect 2016 cash flows from operations to be between $1.3 and $1.5 billion in 2016 and capital expenditures to
be approximately $300 million.
Our capital allocation plan for 2016 includes the following:
• Share repurchase and dividends – we plan to spend more than 50% of free cash flow (cash flow from
operations less capital expenditures) on dividends and share repurchases. We recently announced an 11%
increase in the quarterly dividend to 7.75 cents per share, beginning with the dividend payable on April 29,
2016. This will result in common dividends of approximately $300 million in 2016, which is in line with prior year
as share repurchases effectively self-fund the increase.
• Debt – we will manage our debt to maintain our investment grade rating.
• Acquisitions – we expect to invest between $100 and $400 million, focusing on acquiring companies that will
expand our capabilities in attractive markets of our Services and Document Technology segments. We will
maintain the disciplined approach we have established for evaluating and completing acquisitions.
Xerox 2015 Annual Report 28