Xerox 2015 Annual Report Download - page 85
Download and view the complete annual report
Please find page 85 of the 2015 Xerox annual report below. You can navigate through the pages in the report by either clicking on the pages listed below, or by using the keyword search tool below to find specific information within the annual report.-
 1
1 -
2
-
3
-
4
-
5
-
6
-
7
-
8
-
9
-
10
-
11
-
12
-
13
-
14
-
15
-
16
-
17
-
18
-
19
-
20
-
21
-
22
-
23
-
24
-
25
-
26
-
27
-
28
-
29
-
30
-
31
-
32
-
33
-
34
-
35
-
36
-
37
-
38
-
39
-
40
-
41
-
42
-
43
-
44
-
45
-
46
-
47
-
48
-
49
-
50
-
51
-
52
-
53
-
54
-
55
-
56
-
57
-
58
-
59
-
60
-
61
-
62
-
63
-
64
-
65
-
66
-
67
-
68
-
69
-
70
-
71
-
72
-
73
-
74
-
 75
75 -
 76
76 -
 77
77 -
 78
78 -
 79
79 -
 80
80 -
 81
81 -
 82
82 -
 83
83 -
 84
84 -
 85
85 -
 86
86 -
 87
87 -
 88
88 -
 89
89 -
 90
90 -
 91
91 -
 92
92 -
 93
93 -
 94
94 -
 95
95 -
96
-
97
-
98
-
99
-
100
-
101
-
102
-
103
-
104
-
105
-
106
-
107
-
108
-
109
-
110
-
111
-
112
-
113
-
114
-
115
-
116
-
117
-
118
-
119
-
120
-
121
-
122
-
123
-
124
-
125
-
126
-
127
-
128
-
129
-
130
-
131
-
132
-
133
-
134
-
135
-
136
-
137
-
138
-
139
-
140
-
141
-
142
-
143
-
144
-
145
-
146
-
147
-
148
-
149
-
150
-
151
-
152
-
153
-
154
-
155
-
156
-
157
-
158
 |
 |

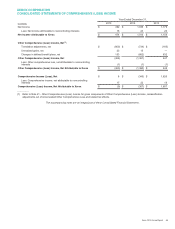
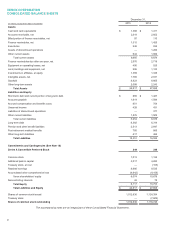
XEROX CORPORATION
CONSOLIDATED STATEMENTS OF CASH FLOWS
Year Ended December 31,
(in millions) 2015 2014 2013
Cash Flows from Operating Activities:
Net income $ 492 $ 1,036 $ 1,179
Adjustments required to reconcile net income to cash flows from operating activities:
Depreciation and amortization 1,190 1,426 1,358
Provision for receivables 58 53 123
Provision for inventory 30 26 35
Deferred tax expense 32 69 117
Net loss (gain) on sales of businesses and assets 57 134 (45)
Undistributed equity in net income of unconsolidated affiliates (79) (91) (92)
Stock-based compensation 46 91 90
Restructuring and asset impairment charges 186 130 116
Payments for restructurings (98) (133) (136)
Contributions to defined benefit pension plans (309) (284) (230)
Decrease (increase) in accounts receivable and billed portion of finance receivables 111 (436) (576)
Collections of deferred proceeds from sales of receivables 259 434 482
Increase in inventories (101) (22) (38)
Increase in equipment on operating leases (291) (283) (303)
(Increase) decrease in finance receivables (8) (10) 609
Collections on beneficial interest from sales of finance receivables 46 79 58
Increase in other current and long-term assets (71) (159) (145)
Increase (decrease) in accounts payable and accrued compensation 38 128 (29)
Increase (decrease) in other current and long-term liabilities 183 (64) (50)
Other operating, net (160) (61) (148)
Net cash provided by operating activities 1,611 2,063 2,375
Cash Flows from Investing Activities:
Cost of additions to land, buildings and equipment (251) (368) (346)
Proceeds from sales of land, buildings and equipment 93 54 86
Cost of additions to internal use software (91) (84) (81)
Proceeds from sale of businesses 939 26 26
Acquisitions, net of cash acquired (210) (340) (155)
Other investing, net 28 9 18
Net cash provided by (used in) investing activities 508 (703) (452)
Cash Flows from Financing Activities:
Net (payments) proceeds on short-term debt (147) 145 5
Proceeds from issuance of long-term debt 1,079 808 617
Payments on long-term debt (1,302) (1,128) (1,056)
Common stock dividends (302) (289) (272)
Preferred stock dividends (24) (24) (24)
Proceeds from issuances of common stock 19 55 124
Excess tax benefits from stock-based compensation 19 18 16
Payments to acquire treasury stock, including fees (1,302) (1,071) (696)
Repurchases related to stock-based compensation (51) (41) (57)
Distributions to noncontrolling interests (62) (87) (56)
Other financing (1) (10) (3)
Net cash used in financing activities (2,074) (1,624)(1,402)
Effect of exchange rate changes on cash and cash equivalents (88) (89) (3)
(Decrease) increase in cash and cash equivalents (43) (353) 518
Cash and cash equivalents at beginning of year 1,411 1,764 1,246
Cash and Cash Equivalents at End of Year $1,368$1,411 $ 1,764
The accompanying notes are an integral part of these Consolidated Financial Statements.
Xerox 2015 Annual Report 68