Xerox 2015 Annual Report Download - page 75
Download and view the complete annual report
Please find page 75 of the 2015 Xerox annual report below. You can navigate through the pages in the report by either clicking on the pages listed below, or by using the keyword search tool below to find specific information within the annual report.Off-Balance Sheet Arrangements
We may occasionally utilize off-balance sheet arrangements in our operations (as defined by the SEC Financial
Reporting Release 67 (FRR-67), “Disclosure in Management’s Discussion and Analysis about Off-Balance Sheet
Arrangements and Aggregate Contractual Obligations”). We enter into the following arrangements that have off-
balance sheet elements:
• Operating leases in the normal course of business. The nature of these lease arrangements is discussed in Note
8 - Land, Buildings, Equipment and Software, Net in the Consolidated Financial Statements.
• We have facilities, primarily in the U.S., Canada and several countries in Europe that enable us to sell to third-
parties certain accounts receivable without recourse. In most instances, a portion of the sales proceeds are held
back by the purchaser and payment is deferred until collection of the related sold receivables. Refer to Note 5 -
Accounts Receivables, Net in the Consolidated Financial Statements for further information regarding these
facilities.
• During 2013 and 2012, we entered into arrangements to transfer and sell our entire interest in certain groups of
finance receivables where we received cash and beneficial interests from the third-party purchaser. Refer to
Note 6 - Finance Receivables, Net in the Consolidated Financial Statements for further information regarding
these sales. There were no sales of Finance Receivables since the year ended December 31, 2013.
As of December 31, 2015, we do not believe we have any off-balance sheet arrangements that have, or are
reasonably likely to have, a material current or future effect on financial condition, changes in financial condition,
revenues or expenses, results of operations, liquidity, capital expenditures or capital resources.
In addition, see the preceding table for the Company's contractual cash obligations and other commercial
commitments and Note 18 - Contingencies and Litigation in the Consolidated Financial Statements for additional
information regarding contingencies, guarantees, indemnifications and warranty liabilities.
Non-GAAP Financial Measures
We have reported our financial results in accordance with generally accepted accounting principles (GAAP). In
addition, we have discussed our results using non-GAAP measures.
Management believes that these non-GAAP financial measures provide an additional means of analyzing the current
periods’ results against the corresponding prior periods’ results. However, these non-GAAP financial measures
should be viewed in addition to, and not as a substitute for, the Company’s reported results prepared in accordance
with GAAP. Our non-GAAP financial measures are not meant to be considered in isolation or as a substitute for
comparable GAAP measures and should be read only in conjunction with our consolidated financial statements
prepared in accordance with GAAP. Our management regularly uses our supplemental non-GAAP financial
measures internally to understand, manage and evaluate our business and make operating decisions. These non-
GAAP measures are among the primary factors management uses in planning for and forecasting future periods.
Compensation of our executives is based in part on the performance of our business based on these non-GAAP
measures.
A reconciliation of these non-GAAP financial measures and the most directly comparable measures calculated and
presented in accordance with GAAP are set forth on the following tables.
Adjusted Revenue, Costs and Expenses, and Margin
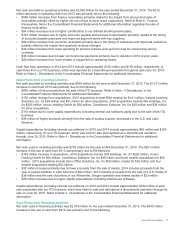
As previously discussed, during third quarter 2015, we recorded a pre-tax charge, the Health Enterprise (HE) charge,
of $389 million ($241 million after-tax or 23 cents per share), which included a $116 million reduction to revenues.
(See Services Segment within the "Operations Review of Segment Revenue and Profit" section for additional
details). As a result of the significant impact of the HE charge on our reported revenues, costs and expenses as well
as key metrics for the period, we also discussed our results using non-GAAP measures which excluded the impact of
the HE charge. In addition to the magnitude of the charge and its impact on our reported results, we excluded the HE
charge due to the fact that it was primarily a unique charge associated with the determination, reached after a series
of discussions, that fully completing our HE platform implementations in California and Montana was no longer
considered probable.
Xerox 2015 Annual Report 58


