Xerox 2015 Annual Report Download - page 2
Download and view the complete annual report
Please find page 2 of the 2015 Xerox annual report below. You can navigate through the pages in the report by either clicking on the pages listed below, or by using the keyword search tool below to find specific information within the annual report.-
 1
1 -
 2
2 -
 3
3 -
 4
4 -
 5
5 -
 6
6 -
 7
7 -
 8
8 -
 9
9 -
 10
10 -
 11
11 -
 12
12 -
 13
13 -
14
-
15
-
16
-
17
-
18
-
19
-
20
-
21
-
22
-
23
-
24
-
25
-
26
-
27
-
28
-
29
-
30
-
31
-
32
-
33
-
34
-
35
-
36
-
37
-
38
-
39
-
40
-
41
-
42
-
43
-
44
-
45
-
46
-
47
-
48
-
49
-
50
-
51
-
52
-
53
-
54
-
55
-
56
-
57
-
58
-
59
-
60
-
61
-
62
-
63
-
64
-
65
-
66
-
67
-
68
-
69
-
70
-
71
-
72
-
73
-
74
-
75
-
76
-
77
-
78
-
79
-
80
-
81
-
82
-
83
-
84
-
85
-
86
-
87
-
88
-
89
-
90
-
91
-
92
-
93
-
94
-
95
-
96
-
97
-
98
-
99
-
100
-
101
-
102
-
103
-
104
-
105
-
106
-
107
-
108
-
109
-
110
-
111
-
112
-
113
-
114
-
115
-
116
-
117
-
118
-
119
-
120
-
121
-
122
-
123
-
124
-
125
-
126
-
127
-
128
-
129
-
130
-
131
-
132
-
133
-
134
-
135
-
136
-
137
-
138
-
139
-
140
-
141
-
142
-
143
-
144
-
145
-
146
-
147
-
148
-
149
-
150
-
151
-
152
-
153
-
154
-
155
-
156
-
157
-
158
 |
 |

2 Letter to Shareholders
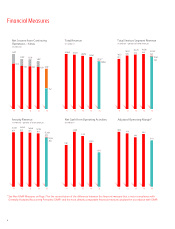
6 Financial Measures
7 Non-GAAP Measures
8 A New Path Forward
10 Board of Directors
11 Officers
12 FYI
2015 Form 10-K Insert
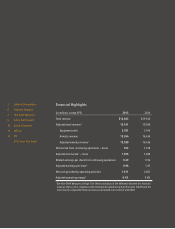
Financial Highlights
(in millions, except EPS) 2015 2014
Total revenue $18,045 $19,540
Adjusted total revenue* 18,161 19,540
Equipment sales 2,781 3,104
Annuity revenue 15,264 16,436
Adjusted annuity revenue* 15,380 16,436
Net income from continuing operations – Xerox 552 1,128
Adjusted net income* – Xerox 1,076 1,280
Diluted earnings per share from continuing operations 0.49 0.94
Adjusted earnings per share* 0.98 1.07
Net cash provided by operating activities 1,611 2,063
Adjusted operating margin* 8.4% 9.6%
* See Non-GAAP Measures on Page 7 for the reconciliation of the difference between this financial
measure that is not in compliance with Generally Accepted Accounting Principles (GAAP) and the
most directly comparable financial measure calculated in accordance with GAAP.