Xerox 2015 Annual Report Download - page 58
Download and view the complete annual report
Please find page 58 of the 2015 Xerox annual report below. You can navigate through the pages in the report by either clicking on the pages listed below, or by using the keyword search tool below to find specific information within the annual report.-
 1
1 -
2
-
3
-
4
-
5
-
6
-
7
-
8
-
9
-
10
-
11
-
12
-
13
-
14
-
15
-
16
-
17
-
18
-
19
-
20
-
21
-
22
-
23
-
24
-
25
-
26
-
27
-
28
-
29
-
30
-
31
-
32
-
33
-
34
-
35
-
36
-
37
-
38
-
39
-
40
-
41
-
42
-
43
-
44
-
45
-
46
-
47
-
 48
48 -
 49
49 -
 50
50 -
 51
51 -
 52
52 -
 53
53 -
 54
54 -
 55
55 -
 56
56 -
 57
57 -
 58
58 -
 59
59 -
 60
60 -
 61
61 -
 62
62 -
 63
63 -
 64
64 -
 65
65 -
 66
66 -
 67
67 -
 68
68 -
69
-
70
-
71
-
72
-
73
-
74
-
75
-
76
-
77
-
78
-
79
-
80
-
81
-
82
-
83
-
84
-
85
-
86
-
87
-
88
-
89
-
90
-
91
-
92
-
93
-
94
-
95
-
96
-
97
-
98
-
99
-
100
-
101
-
102
-
103
-
104
-
105
-
106
-
107
-
108
-
109
-
110
-
111
-
112
-
113
-
114
-
115
-
116
-
117
-
118
-
119
-
120
-
121
-
122
-
123
-
124
-
125
-
126
-
127
-
128
-
129
-
130
-
131
-
132
-
133
-
134
-
135
-
136
-
137
-
138
-
139
-
140
-
141
-
142
-
143
-
144
-
145
-
146
-
147
-
148
-
149
-
150
-
151
-
152
-
153
-
154
-
155
-
156
-
157
-
158
 |
 |

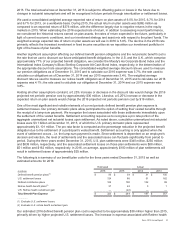
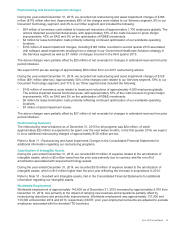
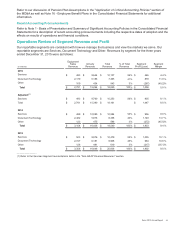
Other Expenses, Net
Year Ended December 31,
(in millions) 2015 2014 2013
Non-financing interest expense $223 $237 $240
Interest income (8) (10)(11)
Gains on sales of businesses and assets(1) (44)(50)(64)
Currency losses (gains), net 65
(7)
Litigation matters 16 11 (34)
Loss on sales of accounts receivables 13 15 17
Deferred compensation investment losses (gains) 1(7) (15)
All other expenses, net 26 31 20
Total Other Expenses, Net $233 $232 $146
_______________
(1) Excludes the loss on sale of the ITO business reported in discontinued operations. Refer to Note 4 - Divestitures for additional information.
Note: Total Other Expenses, Net with the exception of Deferred compensation investment losses (gains) are
included in the Other segment. Deferred compensation investment losses (gains) are included in the Services
segment together with the related deferred compensation expense/income.
Non-Financing Interest Expense: Non-financing interest expense for the year ended December 31, 2015 of $223
million was $14 million lower than prior year primarily due to the benefit of lower borrowing costs achieved as a
result of refinancing existing debt. When non-financing interest expense is combined with financing interest
expense (cost of financing), total company interest expense declined by $24 million from the prior year, primarily
driven by a lower total average debt balance and lower average cost of debt.
Non-financing interest expense for the year ended December 31, 2014 of $237 million was $3 million lower than
prior year primarily due to the benefit of lower borrowing costs achieved as a result of refinancing existing debt.
When non-financing interest expense is combined with financing interest expense (cost of financing), total company
interest expense declined by $26 million from the prior year, primarily driven by a lower total average debt balance
and lower average cost of debt.
Refer to Note 13 - Debt in the Consolidated Financial Statements for additional information regarding our allocation
of interest expense.
Gains on Sales of Businesses and Assets: The 2015 net gain on sales of businesses and assets of $44 million
reflected a gain of approximately $25 million on the sale of surplus real estate in Latin America and gains of
approximately $20 million for surplus technology assets.
The 2014 gains on sales of businesses and assets was primarily related to the sales of surplus properties with $39
million related to sales in Latin America and $8 million related to a sale in the U.S.
The 2013 gains on sales of businesses and assets include the following transactions:
• A $29 million gain on the $32.5 million cash sale of a portion of our Wilsonville, Oregon product design,
engineering and chemistry group and related assets that were surplus to our needs.
• A $23 million gain on the sale of a surplus facility in the U.S.
• An $8 million gain on the sale of a surplus facility in Latin America.
Currency Losses (Gains), Net: Currency losses (gains) primarily result from the re-measurement of foreign
currency-denominated assets and liabilities, the cost of hedging foreign currency-denominated assets and liabilities
and the mark-to-market of foreign exchange contracts utilized to hedge those foreign currency-denominated assets
and liabilities.
Litigation Matters: Litigation matters in 2015 reflect probable losses and reserves for various legal matters.
Litigation matters in 2014 reflect probable losses and reserves for various legal matters partially offset by the
favorable resolution of our securities litigation matter. Litigation matters for 2013 primarily reflect the benefit resulting
from a reserve reduction associated with litigation developments.
41