Xerox 2015 Annual Report Download - page 120
Download and view the complete annual report
Please find page 120 of the 2015 Xerox annual report below. You can navigate through the pages in the report by either clicking on the pages listed below, or by using the keyword search tool below to find specific information within the annual report.-
 1
1 -
2
-
3
-
4
-
5
-
6
-
7
-
8
-
9
-
10
-
11
-
12
-
13
-
14
-
15
-
16
-
17
-
18
-
19
-
20
-
21
-
22
-
23
-
24
-
25
-
26
-
27
-
28
-
29
-
30
-
31
-
32
-
33
-
34
-
35
-
36
-
37
-
38
-
39
-
40
-
41
-
42
-
43
-
44
-
45
-
46
-
47
-
48
-
49
-
50
-
51
-
52
-
53
-
54
-
55
-
56
-
57
-
58
-
59
-
60
-
61
-
62
-
63
-
64
-
65
-
66
-
67
-
68
-
69
-
70
-
71
-
72
-
73
-
74
-
75
-
76
-
77
-
78
-
79
-
80
-
81
-
82
-
83
-
84
-
85
-
86
-
87
-
88
-
89
-
90
-
91
-
92
-
93
-
94
-
95
-
96
-
97
-
98
-
99
-
100
-
101
-
102
-
103
-
104
-
105
-
106
-
107
-
108
-
109
-
 110
110 -
 111
111 -
 112
112 -
 113
113 -
 114
114 -
 115
115 -
 116
116 -
 117
117 -
 118
118 -
 119
119 -
 120
120 -
 121
121 -
 122
122 -
 123
123 -
 124
124 -
 125
125 -
 126
126 -
 127
127 -
 128
128 -
 129
129 -
 130
130 -
131
-
132
-
133
-
134
-
135
-
136
-
137
-
138
-
139
-
140
-
141
-
142
-
143
-
144
-
145
-
146
-
147
-
148
-
149
-
150
-
151
-
152
-
153
-
154
-
155
-
156
-
157
-
158
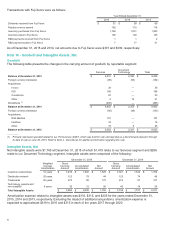
 |
 |

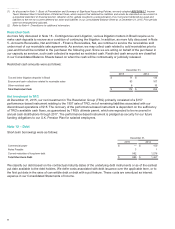
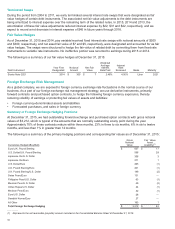
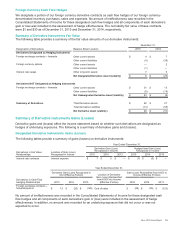
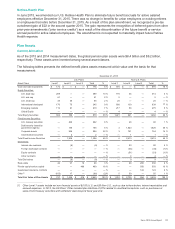
Terminated Swaps
During the period from 2004 to 2011, we early terminated several interest rate swaps that were designated as fair
value hedges of certain debt instruments. The associated net fair value adjustments to the debt instruments are
being amortized to interest expense over the remaining term of the related notes. In 2015, 2014 and 2013, the
amortization of these fair value adjustments reduced interest expense by $22, $31 and $42, respectively, and we
expect to record a net decrease in interest expense of $46 in future years through 2018.
Fair Value Hedges
As of December 31, 2015 and 2014, pay variable/received fixed interest rate swaps with notional amounts of $300
and $300, respectively, and net asset fair value of $7 and $5, respectively, were designated and accounted for as fair
value hedges. The swaps were structured to hedge the fair value of related debt by converting them from fixed rate
instruments to variable rate instruments. No ineffective portion was recorded to earnings during 2015 or 2014.
The following is a summary of our fair value hedges at December 31, 2015:
Debt Instrument
Year First
Designated
Notional
Amount
Net Fair
Value
Weighted
Average
Interest
Rate Paid
Interest
Rate
Received Basis Maturity
Senior Note 2021 2014 $ 300 $ 7 2.46%4.50% Libor 2021
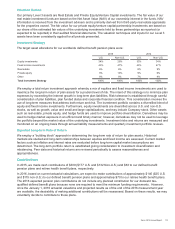
Foreign Exchange Risk Management
As a global company, we are exposed to foreign currency exchange rate fluctuations in the normal course of our
business. As a part of our foreign exchange risk management strategy, we use derivative instruments, primarily
forward contracts and purchased option contracts, to hedge the following foreign currency exposures, thereby
reducing volatility of earnings or protecting fair values of assets and liabilities:
• Foreign currency-denominated assets and liabilities
• Forecasted purchases, and sales in foreign currency
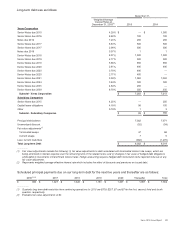
Summary of Foreign Exchange Hedging Positions
At December 31, 2015, we had outstanding forward exchange and purchased option contracts with gross notional
values of $3,212, which is typical of the amounts that are normally outstanding at any point during the year.
Approximately 70% of these contracts mature within three months, 23% in three to six months, 6% in six to twelve
months, and less than 1% in greater than 12 months.
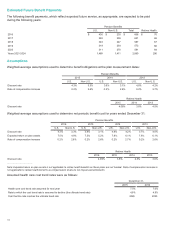
The following is a summary of the primary hedging positions and corresponding fair values as of December 31, 2015:
Currencies Hedged (Buy/Sell)
Gross
Notional
Value
Fair Value
Asset
(Liability)(1)
Euro/U.K. Pound Sterling $837 $17
U.S. Dollar/U.K. Pound Sterling 596 29
Japanese Yen/U.S. Dollar 356 3
Japanese Yen/Euro 271 1
U.S. Dollar/Euro 265 (1)
U.K. Pound Sterling/Euro 201 (1)
U.K. Pound Sterling/U.S. Dollar 149 (2)
Swiss Franc/Euro 131 —
Philippine Peso/U.S. Dollar 63 (1)
Mexican Peso/U.S. Dollar 49 (2)
Indian Rupee/U.S. Dollar 44 (1)
Mexican Peso/Euro 32 (1)
Euro/U.S. Dollar 28 —
Swedish Kroner/Euro 27 —
All Other 163 1
Total Foreign Exchange Hedging $3,212 $42
____________
(1) Represents the net receivable (payable) amount included in the Consolidated Balance Sheet at December 31, 2015.
103