Xerox 2015 Annual Report Download - page 70
Download and view the complete annual report
Please find page 70 of the 2015 Xerox annual report below. You can navigate through the pages in the report by either clicking on the pages listed below, or by using the keyword search tool below to find specific information within the annual report.-
 1
1 -
2
-
3
-
4
-
5
-
6
-
7
-
8
-
9
-
10
-
11
-
12
-
13
-
14
-
15
-
16
-
17
-
18
-
19
-
20
-
21
-
22
-
23
-
24
-
25
-
26
-
27
-
28
-
29
-
30
-
31
-
32
-
33
-
34
-
35
-
36
-
37
-
38
-
39
-
40
-
41
-
42
-
43
-
44
-
45
-
46
-
47
-
48
-
49
-
50
-
51
-
52
-
53
-
54
-
55
-
56
-
57
-
58
-
59
-
 60
60 -
 61
61 -
 62
62 -
 63
63 -
 64
64 -
 65
65 -
 66
66 -
 67
67 -
 68
68 -
 69
69 -
 70
70 -
 71
71 -
 72
72 -
 73
73 -
 74
74 -
 75
75 -
 76
76 -
 77
77 -
 78
78 -
 79
79 -
 80
80 -
81
-
82
-
83
-
84
-
85
-
86
-
87
-
88
-
89
-
90
-
91
-
92
-
93
-
94
-
95
-
96
-
97
-
98
-
99
-
100
-
101
-
102
-
103
-
104
-
105
-
106
-
107
-
108
-
109
-
110
-
111
-
112
-
113
-
114
-
115
-
116
-
117
-
118
-
119
-
120
-
121
-
122
-
123
-
124
-
125
-
126
-
127
-
128
-
129
-
130
-
131
-
132
-
133
-
134
-
135
-
136
-
137
-
138
-
139
-
140
-
141
-
142
-
143
-
144
-
145
-
146
-
147
-
148
-
149
-
150
-
151
-
152
-
153
-
154
-
155
-
156
-
157
-
158
 |
 |

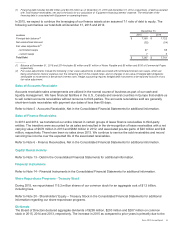
• $231 million increase in share repurchases.
• $195 million increase from net debt activity. 2015 reflects payment of $1,250 million on Senior Notes and a
decrease of $150 million in Commercial Paper offset by net proceeds of $1,045 million from the issuance of
Senior Notes. 2014 reflects payments of $1,050 million on Senior Notes offset by net proceeds of $700 million
from the issuance of Senior Notes and an increase of $150 million in Commercial Paper.
• $36 million increase due to lower proceeds from the issuance of common stock under our incentive stock plans.
• $25 million decrease due to lower distributions to noncontrolling interests.
Net cash used in financing activities was $1,624 million for the year ended December 31, 2014. The $222 million
increase in the use of cash from 2013 was primarily due to the following:
• $375 million increase in share repurchases.
• $69 million increase due to lower proceeds from the issuance of common stock under our incentive stock plans.
• $48 million increase due to higher common stock dividends of $17 million as well as distributions to
noncontrolling interests of $31 million.
• $259 million decrease from net debt activity. 2014 reflects payments of $1,050 million on Senior Notes offset by
net proceeds of $700 million from the issuance of Senior Notes and an increase of $150 million in Commercial
Paper. 2013 reflects payments of $1 billion of Senior Notes offset by net proceeds of $500 million from the
issuance of Senior Notes and $39 million from the sale and capital leaseback of a building in the U.S.
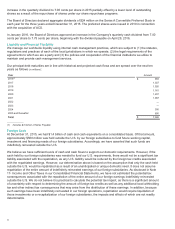
Customer Financing Activities and Debt
We provide lease equipment financing to our customers, primarily in our Document Technology segment. Our lease
contracts permit customers to pay for equipment over time rather than at the date of installation. Our investment in
these contracts is reflected in Total finance assets, net. We primarily fund our customer financing activity through
cash generated from operations, cash on hand, commercial paper borrowings, sales and securitizations of finance
receivables and proceeds from capital markets offerings.
We have arrangements in certain international countries and domestically with our small and mid-sized customers,
where third-party financial institutions independently provide lease financing directly to our customers, on a non-
recourse basis to Xerox. In these arrangements, we sell and transfer title of the equipment to these financial
institutions. Generally, we have no continuing ownership rights in the equipment subsequent to its sale; therefore, the
unrelated third-party finance receivable and debt are not included in our Consolidated Financial Statements.
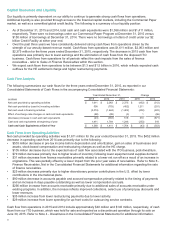
The following represents our Total finance assets, net associated with our lease and finance operations:
December 31,
(in millions) 2015 2014
Total Finance receivables, net(1) $3,988 $ 4,254
Equipment on operating leases, net 495 525
Total Finance Assets, Net (2) $4,483 $ 4,779
_________
(1) Includes (i) billed portion of finance receivables, net, (ii) finance receivables, net and (iii) finance receivables due after one year, net as included
in our Consolidated Balance Sheets.
(2) The change from December 31, 2014 includes a decrease of $247 million due to currency across all Finance Assets.
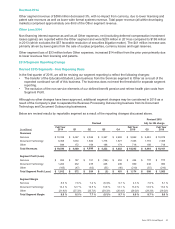
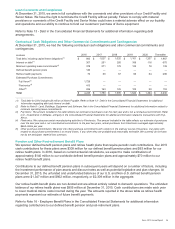
We maintain a certain level of debt, referred to as financing debt, to support our investment in these lease contracts
or Total finance assets, net. We maintain this financing debt at an assumed 7:1 leverage ratio of debt to equity as
compared to our Total finance assets, net for this financing aspect of our business. Based on this leverage, the
following represents the allocation of our total debt at December 31, 2015 and 2014 between financing debt and core
debt:
December 31,
(in millions) 2015 2014
Financing debt(1) $3,923 $ 4,182
Core debt 3,444 3,559
Total Debt $7,367 $ 7,741
_________
53