Xerox 2015 Annual Report Download - page 60
Download and view the complete annual report
Please find page 60 of the 2015 Xerox annual report below. You can navigate through the pages in the report by either clicking on the pages listed below, or by using the keyword search tool below to find specific information within the annual report.-
 1
1 -
2
-
3
-
4
-
5
-
6
-
7
-
8
-
9
-
10
-
11
-
12
-
13
-
14
-
15
-
16
-
17
-
18
-
19
-
20
-
21
-
22
-
23
-
24
-
25
-
26
-
27
-
28
-
29
-
30
-
31
-
32
-
33
-
34
-
35
-
36
-
37
-
38
-
39
-
40
-
41
-
42
-
43
-
44
-
45
-
46
-
47
-
48
-
49
-
 50
50 -
 51
51 -
 52
52 -
 53
53 -
 54
54 -
 55
55 -
 56
56 -
 57
57 -
 58
58 -
 59
59 -
 60
60 -
 61
61 -
 62
62 -
 63
63 -
 64
64 -
 65
65 -
 66
66 -
 67
67 -
 68
68 -
 69
69 -
 70
70 -
71
-
72
-
73
-
74
-
75
-
76
-
77
-
78
-
79
-
80
-
81
-
82
-
83
-
84
-
85
-
86
-
87
-
88
-
89
-
90
-
91
-
92
-
93
-
94
-
95
-
96
-
97
-
98
-
99
-
100
-
101
-
102
-
103
-
104
-
105
-
106
-
107
-
108
-
109
-
110
-
111
-
112
-
113
-
114
-
115
-
116
-
117
-
118
-
119
-
120
-
121
-
122
-
123
-
124
-
125
-
126
-
127
-
128
-
129
-
130
-
131
-
132
-
133
-
134
-
135
-
136
-
137
-
138
-
139
-
140
-
141
-
142
-
143
-
144
-
145
-
146
-
147
-
148
-
149
-
150
-
151
-
152
-
153
-
154
-
155
-
156
-
157
-
158
 |
 |

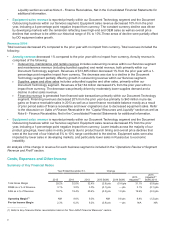
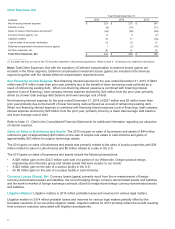
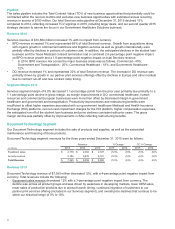
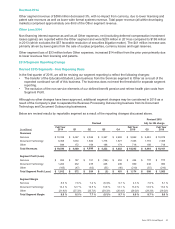
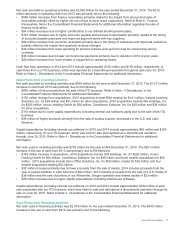
Equity in Net Income of Unconsolidated Affiliates
Year Ended December 31,
(in millions) 2015 2014 2013
Total equity in net income of unconsolidated affiliates $135 $160 $169
Fuji Xerox after-tax restructuring costs 439
Equity in net income of unconsolidated affiliates primarily reflects our 25% share of Fuji Xerox. 2015 equity income
of $135 million decreased $25 million as compared to prior year reflecting the weaker Yen as compared to the U.S.
dollar in 2015 as well as lower Fuji Xerox net income.
Refer to Note 9 - Investment in Affiliates, at Equity, in the Consolidated Financial Statements for additional
information regarding our investment in Fuji Xerox.
Net Income From Continuing Operations
Net income from continuing operations attributable to Xerox for the year ended December 31, 2015 was $552
million, or $0.49 per diluted share. On an adjusted1 basis, net income attributable to Xerox was $1,076 million, or
$0.98 per diluted share, and reflects the adjustments for the amortization of intangible assets as well as the
software impairment charges and the HE charge. Adjusted earnings per diluted share reflected the impact of a
lower average share count as a result of share repurchases over the last three years.
Net income from continuing operations attributable to Xerox for the year ended December 31, 2014 was $1,128
million, or $0.94 per diluted share. On an adjusted1 basis, net income attributable to Xerox was $1,280 million, or
$1.07 per diluted share, and included adjustments for the amortization of intangible assets as well as the deferred
tax liability adjustment in the fourth quarter 2014. The increase in earnings per diluted share reflects a lower
average share count as a result of share repurchases over the last three years.
Net income from continuing operations attributable to Xerox for the year ended December 31, 2013 was $1,139
million, or $0.89 per diluted share. On an adjusted1 basis, net income attributable to Xerox was $1,328 million, or
$1.04 per diluted share, and included adjustments for the amortization of intangible assets.
_____________
(1) See the "Non-GAAP Financial Measures" section for a reconciliation of reported net income from continuing operations to adjusted net
income.
Discontinued Operations
Discontinued operations are primarily related to our sale of the ITO business. As previously noted, in the fourth
quarter 2014, we announced an agreement to sell the ITO business to Atos and began reporting it as a
Discontinued Operation. The sale was completed on June 30, 2015.
Refer to Note 4 - Divestitures in the Consolidated Financial Statements for additional information regarding
Discontinued Operations.
Other Comprehensive (Loss) Income
Other comprehensive loss attributable to Xerox was $483 million in 2015 as compared to a loss of $1,380 million in
2014. The reduction of $897 million was primarily due to net gains from changes in defined benefit plans of $153
million in 2015 as compared to losses of $662 million in 2014. The gains in 2015 are largely the result of the
reclassification of actuarial losses to net income and the currency impacts on deferred actuarial losses. The
remainder of the reduction in other comprehensive loss is related to the $74 million decrease in losses from the
translation of our foreign currency denominated net assets. Both 2015 and 2014 reflect translation losses as a
result of the significant weakening of our major foreign currencies as compared to the U.S. Dollar in both years.
Other comprehensive loss attributable to Xerox was $1,380 million in 2014 as compared to income of $448 million
in 2013. The decrease of $1,828 million from 2013 is primarily the result of losses of $662 million from changes in
our defined benefit plans in 2014 as compared to gains of $632 million in 2013. The benefit plan losses in 2014 are
primarily due to a decrease in the discount rates used to measure our benefit obligations in 2014 as compared to an
increase in rates in 2013. The remainder of the year-over-year decrease in other comprehensive income is related
to the $549 million increase in losses from the translation of our foreign currency denominated net assets as a result
of the increased weakening in 2014 of our major foreign currencies as compared to the U.S. Dollar.
43