Xerox 2015 Annual Report Download - page 110
Download and view the complete annual report
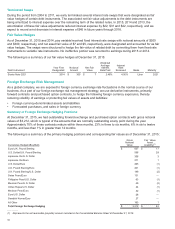
Please find page 110 of the 2015 Xerox annual report below. You can navigate through the pages in the report by either clicking on the pages listed below, or by using the keyword search tool below to find specific information within the annual report.-
 1
1 -
2
-
3
-
4
-
5
-
6
-
7
-
8
-
9
-
10
-
11
-
12
-
13
-
14
-
15
-
16
-
17
-
18
-
19
-
20
-
21
-
22
-
23
-
24
-
25
-
26
-
27
-
28
-
29
-
30
-
31
-
32
-
33
-
34
-
35
-
36
-
37
-
38
-
39
-
40
-
41
-
42
-
43
-
44
-
45
-
46
-
47
-
48
-
49
-
50
-
51
-
52
-
53
-
54
-
55
-
56
-
57
-
58
-
59
-
60
-
61
-
62
-
63
-
64
-
65
-
66
-
67
-
68
-
69
-
70
-
71
-
72
-
73
-
74
-
75
-
76
-
77
-
78
-
79
-
80
-
81
-
82
-
83
-
84
-
85
-
86
-
87
-
88
-
89
-
90
-
91
-
92
-
93
-
94
-
95
-
96
-
97
-
98
-
99
-
 100
100 -
 101
101 -
 102
102 -
 103
103 -
 104
104 -
 105
105 -
 106
106 -
 107
107 -
 108
108 -
 109
109 -
 110
110 -
 111
111 -
 112
112 -
 113
113 -
 114
114 -
 115
115 -
 116
116 -
 117
117 -
 118
118 -
 119
119 -
 120
120 -
121
-
122
-
123
-
124
-
125
-
126
-
127
-
128
-
129
-
130
-
131
-
132
-
133
-
134
-
135
-
136
-
137
-
138
-
139
-
140
-
141
-
142
-
143
-
144
-
145
-
146
-
147
-
148
-
149
-
150
-
151
-
152
-
153
-
154
-
155
-
156
-
157
-
158
 |
 |

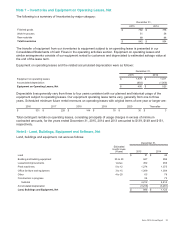
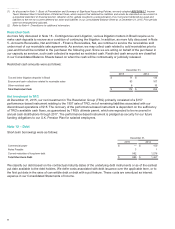
Depreciation expense and operating lease rent expense were as follows:
Year Ended December 31,
2015 2014 2013
Depreciation expense $ 277 $324 $ 332
Operating lease expense 553 560 513
We lease buildings and equipment, substantially all of which are accounted for as operating leases. Capital leased
assets were approximately $98 and $105 at December 31, 2015 and 2014, respectively.
Future minimum operating lease commitments that have initial or remaining non-cancelable lease terms in excess of
one year at December 31, 2015 were as follows:
2016 2017 2018 2019 2020 Thereafter
$ 378 $ 271 $ 178 $ 122 $ 78 $ 139
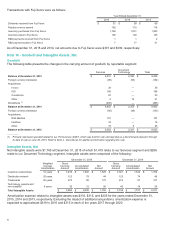
Internal Use and Product Software
Year Ended December 31,
Additions to: 2015 2014 2013
Internal use software $ 91 $ 82 $ 77
Product software 23 23 28
December 31,
Capitalized costs, net: 2015 2014
Internal use software $383 $ 434
Product software 115 307
Useful lives of our internal use and product software generally vary from three to ten years.
Included within product software at December 31, 2015 and 2014 is approximately $55 and $250, respectively, of
capitalized costs associated with software system platforms developed for use in certain of our government services
businesses. During 2015, as a result of our decision to discontinue certain future implementations of these software
system platforms (Government Healthcare Strategy Change), we recorded impairment charges associated with
these software platforms of approximately $160. Our impairment review of the remaining balance at December 31,
2015 indicated that the costs would be recoverable from estimated future operating profits; however, those future
operating profits are dependent on our ability to successfully complete existing contracts as well as obtain future
contracts.
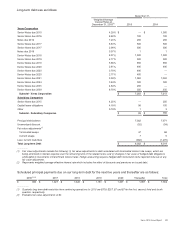
Note 9 – Investment in Affiliates, at Equity
Investments in corporate joint ventures and other companies in which we generally have a 20% to 50% ownership
interest were as follows:
December 31,
2015 2014
Fuji Xerox $1,315 $1,275
Other 74 63
Investments in Affiliates, at Equity $1,389 $1,338
Our equity in net income of our unconsolidated affiliates was as follows:
Year Ended December 31,
2015 2014 2013
Fuji Xerox $117 $147 $156
Other 18 13 13
Total Equity in Net Income of Unconsolidated Affiliates $135 $160 $169
93