Volvo 2014 Annual Report Download - page 9
Download and view the complete annual report
Please find page 9 of the 2014 Volvo annual report below. You can navigate through the pages in the report by either clicking on the pages listed below, or by using the keyword search tool below to find specific information within the annual report.-
 1
1 -
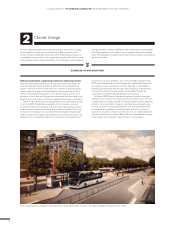
 2
2 -
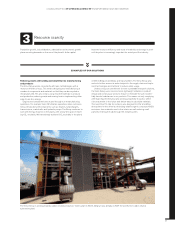
 3
3 -
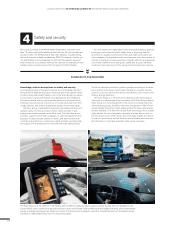
 4
4 -
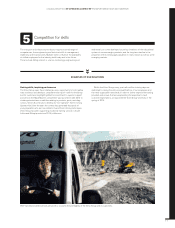
 5
5 -
 6
6 -
 7
7 -
 8
8 -
 9
9 -
 10
10 -
 11
11 -
 12
12 -
 13
13 -
 14
14 -
 15
15 -
 16
16 -
 17
17 -
 18
18 -
 19
19 -
 20
20 -
21
-
22
-
23
-
24
-
25
-
26
-
27
-
28
-
29
-
30
-
31
-
32
-
33
-
34
-
35
-
36
-
37
-
38
-
39
-
40
-
41
-
42
-
43
-
44
-
45
-
46
-
47
-
48
-
49
-
50
-
51
-
52
-
53
-
54
-
55
-
56
-
57
-
58
-
59
-
60
-
61
-
62
-
63
-
64
-
65
-
66
-
67
-
68
-
69
-
70
-
71
-
72
-
73
-
74
-
75
-
76
-
77
-
78
-
79
-
80
-
81
-
82
-
83
-
84
-
85
-
86
-
87
-
88
-
89
-
90
-
91
-
92
-
93
-
94
-
95
-
96
-
97
-
98
-
99
-
100
-
101
-
102
-
103
-
104
-
105
-
106
-
107
-
108
-
109
-
110
-
111
-
112
-
113
-
114
-
115
-
116
-
117
-
118
-
119
-
120
-
121
-
122
-
123
-
124
-
125
-
126
-
127
-
128
-
129
-
130
-
131
-
132
-
133
-
134
-
135
-
136
-
137
-
138
-
139
-
140
-
141
-
142
-
143
-
144
-
145
-
146
-
147
-
148
-
149
-
150
-
151
-
152
-
153
-
154
-
155
-
156
-
157
-
158
-
159
-
160
-
161
-
162
-
163
-
164
-
165
-
166
-
167
-
168
-
169
-
170
-
171
-
172
-
173
-
174
-
175
-
176
-
177
-
178
-
179
-
180
-
181
-
182
-
183
-
184
-
185
-
186
-
187
-
188
-
189
-
190
-
191
-
192
-
193
-
194
 |
 |

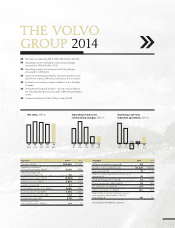
2013
2014
Other markets
Asia
South America
North America
Eastern Europe
Western Europe
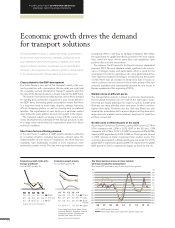
272.6
+1.5 –0.7
+13.2 –2.8
–1.4 +0.5 282.9
Net sales development
SEK bn
2013
Restructuring and
efficiency program
Provision related to EU antitrust investigation
and engine emission case in the U.S.
Effects from Volvo
Rents divestment
2014
Credit losses including provision for
expected credit losses for Volvo CE
Currency impact
Divestment of commercial
real estate
Other
Lower selling and
administrative expenses
Lower research and
development expenditures
Lower capitalization of
development cost
Change in gross income
7.1
+3.4
–2.3
–0.4
–0.7
–1.9
–4.1
+1.7 +5.8
+0.9
+0.9 +0.4
+0.8
Operating income development
SEK bn
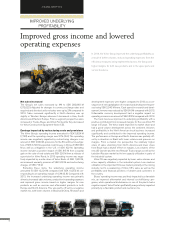
A GLOBAL GROUP 2014 IMPROVED UNDERLYING PROFITABILITY
5