Volvo 2014 Annual Report Download - page 120
Download and view the complete annual report
Please find page 120 of the 2014 Volvo annual report below. You can navigate through the pages in the report by either clicking on the pages listed below, or by using the keyword search tool below to find specific information within the annual report.-
 1
1 -
2
-
3
-
4
-
5
-
6
-
7
-
8
-
9
-
10
-
11
-
12
-
13
-
14
-
15
-
16
-
17
-
18
-
19
-
20
-
21
-
22
-
23
-
24
-
25
-
26
-
27
-
28
-
29
-
30
-
31
-
32
-
33
-
34
-
35
-
36
-
37
-
38
-
39
-
40
-
41
-
42
-
43
-
44
-
45
-
46
-
47
-
48
-
49
-
50
-
51
-
52
-
53
-
54
-
55
-
56
-
57
-
58
-
59
-
60
-
61
-
62
-
63
-
64
-
65
-
66
-
67
-
68
-
69
-
70
-
71
-
72
-
73
-
74
-
75
-
76
-
77
-
78
-
79
-
80
-
81
-
82
-
83
-
84
-
85
-
86
-
87
-
88
-
89
-
90
-
91
-
92
-
93
-
94
-
95
-
96
-
97
-
98
-
99
-
100
-
101
-
102
-
103
-
104
-
105
-
106
-
107
-
108
-
109
-
 110
110 -
 111
111 -
 112
112 -
 113
113 -
 114
114 -
 115
115 -
 116
116 -
 117
117 -
 118
118 -
 119
119 -
 120
120 -
 121
121 -
 122
122 -
 123
123 -
 124
124 -
 125
125 -
 126
126 -
 127
127 -
 128
128 -
 129
129 -
 130
130 -
131
-
132
-
133
-
134
-
135
-
136
-
137
-
138
-
139
-
140
-
141
-
142
-
143
-
144
-
145
-
146
-
147
-
148
-
149
-
150
-
151
-
152
-
153
-
154
-
155
-
156
-
157
-
158
-
159
-
160
-
161
-
162
-
163
-
164
-
165
-
166
-
167
-
168
-
169
-
170
-
171
-
172
-
173
-
174
-
175
-
176
-
177
-
178
-
179
-
180
-
181
-
182
-
183
-
184
-
185
-
186
-
187
-
188
-
189
-
190
-
191
-
192
-
193
-
194
 |
 |

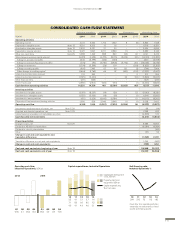
The cash fl ow within Industrial Operations was posi-
tively affected by an operating income of SEK 8.6 bil-
lion excluding the non-cash items related to the EU
antitrust investigation and expected credit losses in
China in a total amount of SEK 4.5 billion. In addition,
the cash fl ow has been positively impacted by higher
depreciations than investments in an amount of SEK
3.6 billion. This was offset by an increase of working
capital of SEK 3.3 billion. Accounts receivables
decreased by SEK 1.3 billion, inventories increased by
SEK 1.6 billion and the trade payables decreased by
SEK 1.0 billion.
Refer to section Investments below for more infor-
mation on the main reasons for the decrease in invest-
ments compared to previous year.
Financial items and paid income taxes had a SEK
4.5 billion negative effect on cash fl ow within Indus-
trial Operations, mainly through payments of interests
and income tax.
Operating cash fl ow within Customer Finance was
negative SEK 5.3 billion (7.6), mainly due to increased
customer-fi nancing receivables and investment in
leasing vehicles.
Investments
The Industrial Operations’ investments in fi xed assets
and capitalized research and development during 2014
amounted to SEK 8.6 billion (12.2). The decrease is
mainly related to lower capitalization of research and
development but also lower investments in fi xed assets.
Capital expenditures in Trucks amounted to SEK
5.7 billion (8.4). The major investments refer to fi nali-
zation of the extensive product renewals that have
taken place, including emission regulation Euro 6, the
new UD Quon for Japan and the new Volvo-range
introduced in South America, with both product devel-
opment activities and required adaptations in the
plants. There are also larger investments in the plants
in order to reduce manufacturing costs, with the Euro-
pean optimization program and rationalizations in the
US plants as main areas. The investments in dealer
networks and workshops are mainly done in Europe
and Asia (mainly Japan and Thailand), primarily for
upgrade and replacements. South America is invest-
ing in a new customer training center.
Capital expenditures for Construction Equipment
amounted to SEK 1.3 billion (2.3). The major invest-
ments during 2014 related to the new customer
center in Shippensburg, investments within our SDLG
brand and various in vestments related to our CAST
(Common Architecture Shared Technology) program.
The product related investments during the year refer
mainly to Tier 4 fi nal, the last emission regulations in
Europe and North America.
The investments in Buses were SEK 0.3 billion
(0.4), and in Penta SEK 0.3 billion (0.3).
Total investments in leasing assets during 2014
amounted to SEK 0.5 billion (1.5).
The investment level for property, plant and equip-
ment during 2014 was lower than previous years.
During 2015, investments in property, plant and
equipment are expected to be on the same level as in
2014. The optimization of the industrial and logistic
footprint, dealer investments and product related tool-
ing will continue to be the main areas.
Acquisitions and divestments
The divestiture of Volvo Rents was completed on Jan-
uary 31, 2014.
The divestiture of commercial real estate was fi nal-
ized in the second quarter of 2014.
The acquisitions of the hauler manufacturing busi-
ness from Terex Inc. was fi nalized on May 30, 2014.
In total acquired and divested operations in 2014 had
a positive impact on cash fl ow of SEK 7.4 billion (0.9).
Read more in Note 3 regarding Acquisitions
and divestments of shares in subsidiaries and
Note 29 Cash fl ow.
Financing and dividend
Net borrowings increased cash and cash equivalents
by SEK 6.7 billion during 2014 (13.0).
Read more in Note 29 Cash fl ow regarding
movements during the year on the net borrowings.
During the year dividend of SEK 6.1 billion, corre-
sponding to SEK 3.00 per share, was paid to the
shareholders of AB Volvo.
Change in cash and cash equivalents
The Volvo Group’s cash and cash equivalents
decreased by SEK 0.7 billion during the year and
amounted to SEK 26.2 billion at December 31, 2014.
Read more in Note 29 Cash fl ow regarding
principles for preparing the cash fl ow statement
and for more information on cash and cash
equivalents.
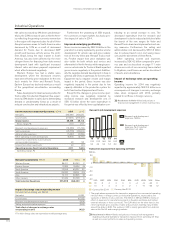
During 2014, operating cash fl ow in the Industrial Operations
amounted to a positive SEK 6.4 billion (1.5).
CASH FLOW STATEMENT
Improved operating
cash fl ow
business and positive currency movements of SEK
27.2 billion related to revaluation of assets in foreign
subsidiaries, offset by the divestment of assets related
to Volvo Rents and of commercial real estate.
The value of other shares and participations
increased by SEK 3.0 billion compared to previous
year. The increase is driven by the fair value adjust-
ment of Eicher Motors Ltd. recognized through other
comprehensive income.
Read more in Note 5 Investments in joint
ventures, associated companies and other shares
and participations regarding other shares and
participations.
Read more in Note 19 Equity and number of
shares regarding the change in other reserves.
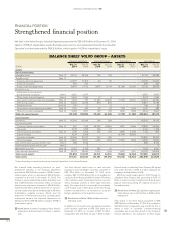
The Group’s intangible assets amounted to SEK 37.1
billion as of December 31, 2014. Investments in
research and development amounted to SEK 1.4 billion
(3.8), resulting in a net value of capitalized develop-
ment costs of SEK 12.5 billion at the end of the year.
Compared to prior year there has been a shift in the
research and development net, from net capitalization
to net amortization, as many projects was fi nalized in
2013. The Volvo Group’s total goodwill amounted to
SEK 21.5 billion as of December 31, 2014, an increase
by SEK 1.5 billion compared to year-end 2013 mainly
as a result of translation differences. The goodwill is
tested for impairment on an annual basis.
Read more in Note 12 Intangible assets
regarding the impairment test on goodwill.
The tangible assets increased by SEK 8.5 billion dur-
ing 2014, mainly related to increase in assets under
operating leases and translation differences.
The value of inventories increased by SEK 4.4
billion. The increase is related to both fi nished products
within Trucks and Construction Equipment and pro-
duction material.
The value of assets held for sale amounted SEK
0.3 billion as of December 31, 2014 compared to SEK
8.1 billion at year-end 2013. The amount last year was
related to the divestment of Volvo Rents and to the
divestment of commercial real estate which were
completed during 2014.
Read more in Note 3 regarding assets and
liabilities held for sale.
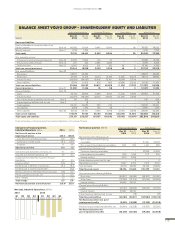
The net value of assets and liabilities related to pen-
sions and similar obligations amounted to SEK 16.6
billion as of December 31, 2014, an increase of SEK
4.3 billion compared to year-end 2013. In 2014 the
Volvo Group recognized a negative remeasurement
effect impacting the pension obligation SEK 5.5 billion,
mainly driven by lower discount rates in the US, Bel-
gium, France, the UK and Sweden. On the asset side
a positive remeasurement effect amounting to SEK
1.9 billion was recognized. In total the remeasurement
recognized through other comprehensive income had
a negative impact of SEK 3.6 billion on the provision
for post-employment benefi ts.
Read more in Note 20 Provisions for post-
employment benefi ts.
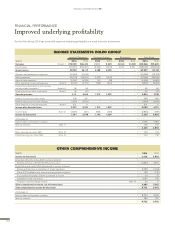
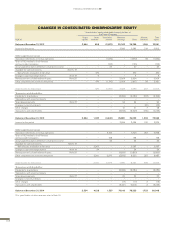
As of December 31, 2014 the shareholders’ equity for
the Volvo Group amounted to SEK 80.0 billion com-
pared to SEK 77.4 billion at year-end 2013. The equity
ratio was 20.9% compared to 22.4% on December
31, 2013. At the same date the equity ratio in the
Industrial operations amounted to 25.7% (27.0).
Cont.
116
FINANCIAL INFORMATION 2014