Volvo 2014 Annual Report Download - page 185
Download and view the complete annual report
Please find page 185 of the 2014 Volvo annual report below. You can navigate through the pages in the report by either clicking on the pages listed below, or by using the keyword search tool below to find specific information within the annual report.-
 1
1 -
2
-
3
-
4
-
5
-
6
-
7
-
8
-
9
-
10
-
11
-
12
-
13
-
14
-
15
-
16
-
17
-
18
-
19
-
20
-
21
-
22
-
23
-
24
-
25
-
26
-
27
-
28
-
29
-
30
-
31
-
32
-
33
-
34
-
35
-
36
-
37
-
38
-
39
-
40
-
41
-
42
-
43
-
44
-
45
-
46
-
47
-
48
-
49
-
50
-
51
-
52
-
53
-
54
-
55
-
56
-
57
-
58
-
59
-
60
-
61
-
62
-
63
-
64
-
65
-
66
-
67
-
68
-
69
-
70
-
71
-
72
-
73
-
74
-
75
-
76
-
77
-
78
-
79
-
80
-
81
-
82
-
83
-
84
-
85
-
86
-
87
-
88
-
89
-
90
-
91
-
92
-
93
-
94
-
95
-
96
-
97
-
98
-
99
-
100
-
101
-
102
-
103
-
104
-
105
-
106
-
107
-
108
-
109
-
110
-
111
-
112
-
113
-
114
-
115
-
116
-
117
-
118
-
119
-
120
-
121
-
122
-
123
-
124
-
125
-
126
-
127
-
128
-
129
-
130
-
131
-
132
-
133
-
134
-
135
-
136
-
137
-
138
-
139
-
140
-
141
-
142
-
143
-
144
-
145
-
146
-
147
-
148
-
149
-
150
-
151
-
152
-
153
-
154
-
155
-
156
-
157
-
158
-
159
-
160
-
161
-
162
-
163
-
164
-
165
-
166
-
167
-
168
-
169
-
170
-
171
-
172
-
173
-
174
-
 175
175 -
 176
176 -
 177
177 -
 178
178 -
 179
179 -
 180
180 -
 181
181 -
 182
182 -
 183
183 -
 184
184 -
 185
185 -
 186
186 -
 187
187 -
 188
188 -
 189
189 -
 190
190 -
 191
191 -
 192
192 -
 193
193 -
 194
194
 |
 |

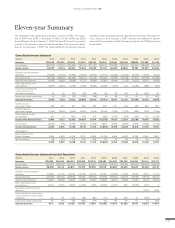
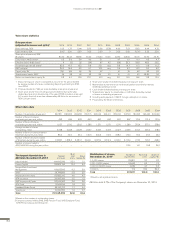
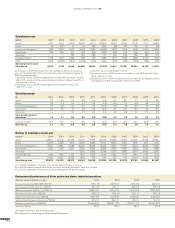
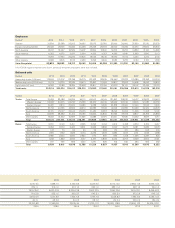
FINANCIAL INFORMATION 2014
Consolidated balance sheets, Industrial Operations
SEK M 2014 2013 2012 2011 2010 2009 2008 2007 2006 2005 2004
Intangible assets 37,010 36,479 40,267 39,385 40,613 41,532 43,909 36,441 19,054 20,348 17,570
Property, plant and equipment 55,087 52,146 54,899 54,446 54,169 55,208 57,185 47,132 30,493 31,330 27,260
Assets under operating leases 19,484 17,013 21,263 16,749 13,217 13,539 16,967 13,850 11,822 10,260 8,477
Shares and participations 9,825 6,321 2,884 1,871 2,080 2,025 1,935 2,189 16,565 10,357 10,116
Inventories 45,364 40,964 40,057 43,828 38,956 35,765 54,084 43,264 33,893 33,583 28,291
Customer-fi nancing receivables 1,828 1,406 1,397 1,702 1,428 1,367 975 1,233 1,193 1,377 230
Interest-bearing receivables 2,777 2,195 11,011 6,734 11,153 8,010 6,056 13,701 13,214 7,691 12,127
Other receivables 70,413 60,679 54,324 59,062 52,358 49,008 60,586 55,970 43,335 43,992 36,535
Non-current assets held for sale 288 8,104 – 9,348 136 1,692 – – 805 – –
Cash and cash equivalents 31,105 28,230 27,146 35,951 31,491 37,404 22,575 30,026 29,907 36,047 34,628
Assets 273,181 253,537 253,248 269,076 245,602 245,550 264,272 243,806 200,281 194,985 175,234
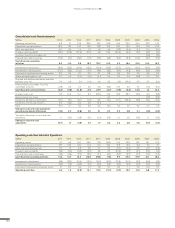
Shareholders’ equity 70,105 68,467 78,321 76,682 66,101 58,485 75,046 75,129 87,188 78,760 70,155
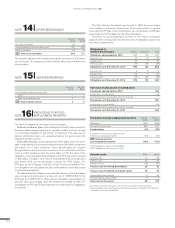
Provision for post-employment benefi ts 16,580 12,249 6,663 6,635 7,478 8,021 11,677 9,746 8,661 11,966 14,677
Other provisions 25,05 4 17,575 19,653 19,101 17,240 17,456 27,015 25, 372 19,385 17,164 14,115
Interest-bearing liabilities 48,180 52,491 54,472 55,394 59,857 78,890 46,749 38,286 9,779 13,097 13,968
Liabilities associated with assets
held for sale 130 350 – 4,716 135 272 – – 280 – –
Other liabilities 113,131 102,405 94,139 106,548 94,791 82,426 103,785 95,273 74,988 73,998 62,319
Shareholders’ equity and
liabilities 273,181 253,537 253,248 269,076 245,602 245,550 264,272 243,806 200,281 194,985 175,234
181