Volvo 2014 Annual Report Download - page 114
Download and view the complete annual report
Please find page 114 of the 2014 Volvo annual report below. You can navigate through the pages in the report by either clicking on the pages listed below, or by using the keyword search tool below to find specific information within the annual report.-
 1
1 -
2
-
3
-
4
-
5
-
6
-
7
-
8
-
9
-
10
-
11
-
12
-
13
-
14
-
15
-
16
-
17
-
18
-
19
-
20
-
21
-
22
-
23
-
24
-
25
-
26
-
27
-
28
-
29
-
30
-
31
-
32
-
33
-
34
-
35
-
36
-
37
-
38
-
39
-
40
-
41
-
42
-
43
-
44
-
45
-
46
-
47
-
48
-
49
-
50
-
51
-
52
-
53
-
54
-
55
-
56
-
57
-
58
-
59
-
60
-
61
-
62
-
63
-
64
-
65
-
66
-
67
-
68
-
69
-
70
-
71
-
72
-
73
-
74
-
75
-
76
-
77
-
78
-
79
-
80
-
81
-
82
-
83
-
84
-
85
-
86
-
87
-
88
-
89
-
90
-
91
-
92
-
93
-
94
-
95
-
96
-
97
-
98
-
99
-
100
-
101
-
102
-
103
-
 104
104 -
 105
105 -
 106
106 -
 107
107 -
 108
108 -
 109
109 -
 110
110 -
 111
111 -
 112
112 -
 113
113 -
 114
114 -
 115
115 -
 116
116 -
 117
117 -
 118
118 -
 119
119 -
 120
120 -
 121
121 -
 122
122 -
 123
123 -
 124
124 -
125
-
126
-
127
-
128
-
129
-
130
-
131
-
132
-
133
-
134
-
135
-
136
-
137
-
138
-
139
-
140
-
141
-
142
-
143
-
144
-
145
-
146
-
147
-
148
-
149
-
150
-
151
-
152
-
153
-
154
-
155
-
156
-
157
-
158
-
159
-
160
-
161
-
162
-
163
-
164
-
165
-
166
-
167
-
168
-
169
-
170
-
171
-
172
-
173
-
174
-
175
-
176
-
177
-
178
-
179
-
180
-
181
-
182
-
183
-
184
-
185
-
186
-
187
-
188
-
189
-
190
-
191
-
192
-
193
-
194
 |
 |

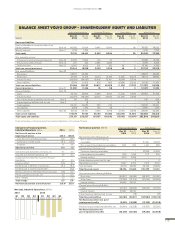
For the Volvo Group 2014 was a year with improved underlying profi tability in a mixed economic environment.
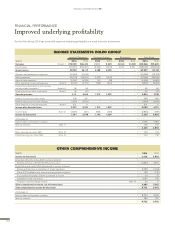
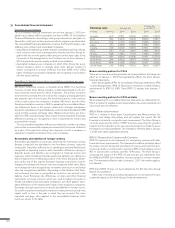
FINANCIAL PERFORMANCE
Improved underlying profi tability
INCOME STATEMENTS VOLVO GROUP
Industrial Operations Customer Finance Eliminations Volvo Group
SEK M 2014 2013 2014 2013 2014 2013 2014 2013
Net sales Note 6, 7 275,999 265,420 10,111 9,539 (3,162) (2,337) 282,948 272,622
Cost of sales (217,251) (209,307) (5,923) (5,534) 3,162 2,337 (220,012) (212,504)
Gross income 58,748 56,113 4,188 4,005 – – 62,937 60,118
Research and development expenses (16,656) (15,124) – – – – (16,656) (15,124)
Selling expenses (25,778) (26,904) (1,670) (1,602) – – (27,448) (28,506)
Administrative expenses (5,367) (5,824) (41) (38) – – (5,408) (5,862)
Other operating income and expenses Note 8 (6,931) (2,710) (766) (843) – – (7,697) (3,554)
Income from investments in joint ventures
and associated companies Note 5, 6 46 96 – – – – 46 96
Income (loss)from other investments Note 5 49 (31) 1 – – – 50 (30)
Operating income 4,111 5,616 1,712 1,522 – – 5,824 7,138
Interest income and similar credits 328 381 – – – – 328 381
Interest expenses and similar charges (1,994) (2,810) – – – – (1,994) (2,810)
Other fi nancial income and expenses Note 9 931 11 – – – – 931 11
Income after fi nancial items 3,377 3,199 1,712 1,522 – – 5,089 4,721
Income taxes Note 10 (2,287) (451) (568) (468) – – (2,854) (919)
Income for the period 1,091 2,748 1,145 1,054 – – 2,235 3,802
Attributable to:
Equity holders of the parent company 2,099 3,583
Minority interests Note 11136219
2,2353,802
Basic earnings per share, SEK Note 19 1.03 1.77
Diluted earnings per share, SEK Note 19 1.03 1.76
OTHER COMPREHENSIVE INCOME
SEK M 2014 2013
Income for the period 2,235 3,802
Items that will not be reclassifi ed to income statement:
Remeasurements of defi ned benefi t pension plans (2,833) 3,904
Items that may be reclassifi ed subsequently to income statement:
Exchange differences on translation of foreign operations 5,998 (1,634)
Share of OCI related to joint ventures and associated companies 198 (135)
Accumulated translation difference reversed to income 33 37
Available-for-sale investments 3,067 470
Change in cash fl ow hedge reserve Note 19 24 9
Other comprehensive income, net of income taxes 6,487 2,651
Total comprehensive income for the period 8,722 6,453
Attributable to:
Equity holders of the parent company 8,334 6,196
Minority interests 388 257
8,722 6,453
110
FINANCIAL INFORMATION 2014