Volvo 2014 Annual Report Download - page 149
Download and view the complete annual report
Please find page 149 of the 2014 Volvo annual report below. You can navigate through the pages in the report by either clicking on the pages listed below, or by using the keyword search tool below to find specific information within the annual report.-
 1
1 -
2
-
3
-
4
-
5
-
6
-
7
-
8
-
9
-
10
-
11
-
12
-
13
-
14
-
15
-
16
-
17
-
18
-
19
-
20
-
21
-
22
-
23
-
24
-
25
-
26
-
27
-
28
-
29
-
30
-
31
-
32
-
33
-
34
-
35
-
36
-
37
-
38
-
39
-
40
-
41
-
42
-
43
-
44
-
45
-
46
-
47
-
48
-
49
-
50
-
51
-
52
-
53
-
54
-
55
-
56
-
57
-
58
-
59
-
60
-
61
-
62
-
63
-
64
-
65
-
66
-
67
-
68
-
69
-
70
-
71
-
72
-
73
-
74
-
75
-
76
-
77
-
78
-
79
-
80
-
81
-
82
-
83
-
84
-
85
-
86
-
87
-
88
-
89
-
90
-
91
-
92
-
93
-
94
-
95
-
96
-
97
-
98
-
99
-
100
-
101
-
102
-
103
-
104
-
105
-
106
-
107
-
108
-
109
-
110
-
111
-
112
-
113
-
114
-
115
-
116
-
117
-
118
-
119
-
120
-
121
-
122
-
123
-
124
-
125
-
126
-
127
-
128
-
129
-
130
-
131
-
132
-
133
-
134
-
135
-
136
-
137
-
138
-
 139
139 -
 140
140 -
 141
141 -
 142
142 -
 143
143 -
 144
144 -
 145
145 -
 146
146 -
 147
147 -
 148
148 -
 149
149 -
 150
150 -
 151
151 -
 152
152 -
 153
153 -
 154
154 -
 155
155 -
 156
156 -
 157
157 -
 158
158 -
 159
159 -
160
-
161
-
162
-
163
-
164
-
165
-
166
-
167
-
168
-
169
-
170
-
171
-
172
-
173
-
174
-
175
-
176
-
177
-
178
-
179
-
180
-
181
-
182
-
183
-
184
-
185
-
186
-
187
-
188
-
189
-
190
-
191
-
192
-
193
-
194
 |
 |
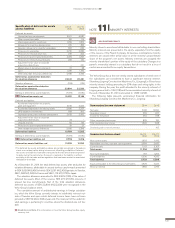
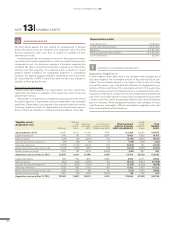
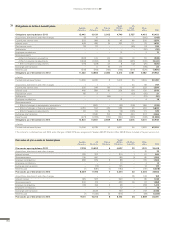
Credit risks in accounts receivable
Change of valuation allowance
for doubtful accounts receivable 2014 2013
Opening balance 606 665
New valuation allowance charged to income 415 291
Reversal of valuation allowance charged
to income (123) (159)
Utilization of valuation allowance related
to actual losses (65) (114)
Acquired and divested operations (23) (16)
Translation differences 60 (19)
Reclassifi cations, etc (36) (42)
Valuation allowance for doubtful accounts
receivables as of December 31 834 606
Refer to Note 15 for information regarding credit risk in customer fi nancing
receivables.
Refer to Note 30 for information regarding goals and policies for fi nancial
instruments.
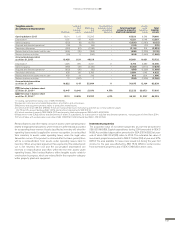
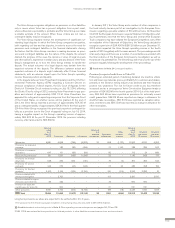
Age analysis of portfolio value
– Accounts receivable
Dec31, 2014 Dec 31, 2013
Not Due 1–30 31–90 >90 Total Not Due 1–30 31–90 >90 Total
Accounts receivable gross 28,572 1,311 578 1,268 31,728 27,056 1,293 593 1,079 30,020
Provision for doubtful accounts receivable (123) (35) (25) (650) (834) (90) (18)(25)(473)(606)
Accounts receivable net 28,449 1,275 553 617 30,895 26,966 1,275 568 606 29,415
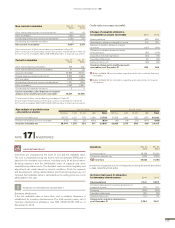
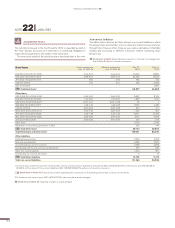
Non-current receivables Dec 31,
2014 Dec 31,
2013
Other interest-bearing loans to external parties
1602 62
Other receivables 2,826 2,631
Outstanding interest and currency risk derivatives
21,526 723
Outstanding raw materials derivatives 0 1
Non-current receivables
34,954 3,417
1 Non-current part of Other interest bearing receivables in Note 30.
2 Non-current part of Outstanding interest and currency risk derivatives in Note 30.
3 Of non-current receivables SEK 2,128 (786) M pertains to fi nancial instruments.
Current receivables Dec31,
2014 Dec 31,
2013
Other interest-bearing receivables
1374 447
Other interest-bearing fi nancial receivables 61 52
Accounts receivable 30,895 29,415
Prepaid expenses and accrued income 2,854 2,356
VAT receivables 3,676 3,033
Outstanding interest and currency risk derivatives
21,351 1,818
Other receivables 7,463 5,854
Outstanding raw materials derivatives 3 4
Current receivables, after deduction of valuation
allowances for doubtful accounts receivable
346,677 42,978
1 Current part of Other interest bearing receivables in Note 30.
2 Current part of Outstanding interest and currency risk derivatives in Note 30.
3 Of current receivables SEK 32,554 M (31,497) pertains to fi nancial instruments.
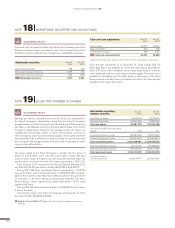
Inventories are recognized at the lower of cost and net realizable value.
The cost is established using the fi rst-in, fi rst-out principle (FIFO) and is
based on the standard cost method, including costs for all direct manu-
facturing expenses and the attributable share of capacity and other
manu facturing-related costs. The standard costs are tested regularly and
adjustments are made based on current conditions. Costs for research
and development, selling, administration and fi nancial expenses are not
in cluded. Net realizable value is calculated as the selling price less costs
attributable to the sale.
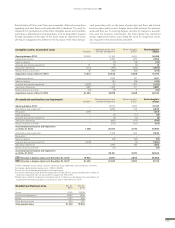
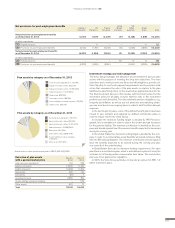
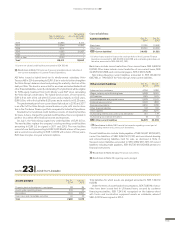
Inventory Dec 31,
2014 Dec 31,
2013
Finished products 28,368 26,339
Production materials, etc. 17,165 14,814
B/S Inventory 45,533 41,153
Inventorie s recognized as cost of sold products during the period amounted
to SEK 199,872 M (191,509).
Increase (decrease) in allowance
for inventory obsolescence 2014 2013
Opening balance 2,641 2,593
Increase in allowance for inventory obsolescence
charged to income 734 510
Scrapping (395) (452)
Translation differences 259 (39)
Reclassifi cations etc. 154 29
Allowance for inventory obsolescence
as of December 31 3,394 2,641
ACCOUNTING POLICY
Inventory obsolescence
If the net realizable value is lower than cost, a valuation allowance is
established for inventory obsolescence. The total inventory value, net of
inventory obsolescence allowance, was SEK 45,533 M (41,153) as of
December 31, 2014.
SOURCES OF ESTIMATION UNCERTAINTY
!
NOTE 17 INVENTORIES
FINANCIAL INFORMATION 2014
145