Volvo 2014 Annual Report Download - page 175
Download and view the complete annual report
Please find page 175 of the 2014 Volvo annual report below. You can navigate through the pages in the report by either clicking on the pages listed below, or by using the keyword search tool below to find specific information within the annual report.-
 1
1 -
2
-
3
-
4
-
5
-
6
-
7
-
8
-
9
-
10
-
11
-
12
-
13
-
14
-
15
-
16
-
17
-
18
-
19
-
20
-
21
-
22
-
23
-
24
-
25
-
26
-
27
-
28
-
29
-
30
-
31
-
32
-
33
-
34
-
35
-
36
-
37
-
38
-
39
-
40
-
41
-
42
-
43
-
44
-
45
-
46
-
47
-
48
-
49
-
50
-
51
-
52
-
53
-
54
-
55
-
56
-
57
-
58
-
59
-
60
-
61
-
62
-
63
-
64
-
65
-
66
-
67
-
68
-
69
-
70
-
71
-
72
-
73
-
74
-
75
-
76
-
77
-
78
-
79
-
80
-
81
-
82
-
83
-
84
-
85
-
86
-
87
-
88
-
89
-
90
-
91
-
92
-
93
-
94
-
95
-
96
-
97
-
98
-
99
-
100
-
101
-
102
-
103
-
104
-
105
-
106
-
107
-
108
-
109
-
110
-
111
-
112
-
113
-
114
-
115
-
116
-
117
-
118
-
119
-
120
-
121
-
122
-
123
-
124
-
125
-
126
-
127
-
128
-
129
-
130
-
131
-
132
-
133
-
134
-
135
-
136
-
137
-
138
-
139
-
140
-
141
-
142
-
143
-
144
-
145
-
146
-
147
-
148
-
149
-
150
-
151
-
152
-
153
-
154
-
155
-
156
-
157
-
158
-
159
-
160
-
161
-
162
-
163
-
164
-
 165
165 -
 166
166 -
 167
167 -
 168
168 -
 169
169 -
 170
170 -
 171
171 -
 172
172 -
 173
173 -
 174
174 -
 175
175 -
 176
176 -
 177
177 -
 178
178 -
 179
179 -
 180
180 -
 181
181 -
 182
182 -
 183
183 -
 184
184 -
 185
185 -
186
-
187
-
188
-
189
-
190
-
191
-
192
-
193
-
194
 |
 |

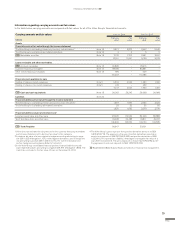
INCOME (LOSS) FROM INVESTMENTS
IN GROUP COMPANIES
NOTE 5
Income from investments in
Group Companies 2014 2013
Dividends received
Volvo China Investment Co. Ltd. 367 312
VFS AB 450 1,080
Volvo Danmark AS 61 –
Volvo East Asia (Pte) Ltd., Singapore 108 105
Volvo Holding Sverige AB 4,500 –
Volvo Korea Holding AB 1,300 –
Volvo Event Management UK Ltd. 1 –
Volvo Norge AS 39 –
Volvo Malaysia Sdn Bhd. – 59
VCE N.V. – 37
Volvo UK Holding Ltd. – 11
Volvo Group UK Ltd. – 85
Subtotal 6,826 1,689
Write-down of shares
Volvo Group UK Ltd. (134) –
Volvo Italia Spa – (63)
Volvo Business Services AB – (40)
Volvo Parts AB – (50)
Volvo Group Japan Corporation – (843)
Subtotal (134) (996)
Income from divestment of shares
Non-compete clause Volvo Rents 0 –
Adjustment divestment Volvo Aero AB 2012 – (106)
Subtotal 0 (106)
Income from investments in Group Companies 6,692 587
Transfer price adjustments and royalties amount to an expense of 1,120
(1,128).
Dividend of 28 (31) was received from VE Commercial Vehicles Ltd. and
of 19 (–) from Deutz AG. Income include write-down of participation in
Blue Chip Jet HB with – (5) and in Blue Chip Jet II HB with 21 (26).
INCOME FROM INVESTMENTS IN JOINT
VENTURES AND ASSOCIATED COMPANIES
NOTE 6
Income from other investments includes a dividend of 7 (5) from Eicher
Motors Ltd. 2013 the shares in Johanneberg Science Park AB and Lind-
holmen Science Park AB were written down by 4.
INCOME FROM OTHER INVESTMENTS
NOTE 7
Interest expenses and similar charges totalling 947 (1,139) included inter-
est of 944 (1,136) to subsidiaries.
INTEREST EXPENSES
NOTE 8
Other fi nancial income and expenses include exchange rate gains and
losses, costs for credit rating and costs for stock exchange listing.
OTHER FINANCIAL INCOME
AND EXPENSES
NOTE 9
Group contributions amounted to a net of 3,504 (832).
ALLOCATIONS
NOTE 10
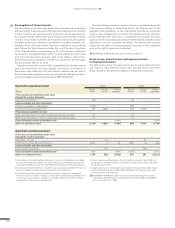
Income taxes were distributed as follow:
2014 2013
Current taxes relating to the period (20) (1)
Current taxes relating to prior periods – (253)
Deferred taxes (359) 587
I/S Total income taxes (379) 333
Deferred taxes relate to estimated tax on the change in tax-loss carryfor-
wards and temporary differences. Deferred tax assets are recognized to
the extent that it is probable that the amount can be utilized against future
taxable income. The tax-loss carry forwards have indefi nite period of
utilization.
Deferred taxes related to change in tax-loss carryforwards amount to
an expense of 357 (income of 590) and to changes in other temporary
differences to an expense of 2 (3).
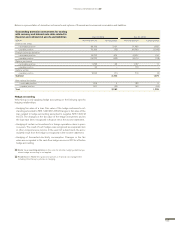
The table below discloses the principal reasons for the difference
between the corporate income tax of 22% and the tax for the period.
2014 2013
Income before taxes 7,069 (1,954)
Income tax according to applicable tax rate (1,555) 430
Capital gains/losses – (23)
Non-taxable dividends 1,513 380
Non-taxable revaluations of shareholdings (34) (227)
Other non-deductible expenses (23) (15)
Other non-taxable income 10 42
Adjustment of current taxes for prior periods – (253)
Withholding tax (20) (1)
Remeasurement of deferred tax assets (269) –
Recognition and derecognition of deferred tax
assetsdue to change in tax rate (1) –
Income taxes for the period (379) 333
Specifi cation of deferred tax assets Dec 31,
2014 Dec 31,
2013
Unused tax-loss carryforwards 2,037 2,394
Provisions for post-employmentbenefi ts 150 149
Provisions for restructuring measures 4 7
B/S Deferred tax assets 2,191 2,550
NOTE 11 INCOME TAXES
FINANCIAL INFORMATION 2014
171