Volvo 2014 Annual Report Download - page 84
Download and view the complete annual report
Please find page 84 of the 2014 Volvo annual report below. You can navigate through the pages in the report by either clicking on the pages listed below, or by using the keyword search tool below to find specific information within the annual report.-
 1
1 -
2
-
3
-
4
-
5
-
6
-
7
-
8
-
9
-
10
-
11
-
12
-
13
-
14
-
15
-
16
-
17
-
18
-
19
-
20
-
21
-
22
-
23
-
24
-
25
-
26
-
27
-
28
-
29
-
30
-
31
-
32
-
33
-
34
-
35
-
36
-
37
-
38
-
39
-
40
-
41
-
42
-
43
-
44
-
45
-
46
-
47
-
48
-
49
-
50
-
51
-
52
-
53
-
54
-
55
-
56
-
57
-
58
-
59
-
60
-
61
-
62
-
63
-
64
-
65
-
66
-
67
-
68
-
69
-
70
-
71
-
72
-
73
-
 74
74 -
 75
75 -
 76
76 -
 77
77 -
 78
78 -
 79
79 -
 80
80 -
 81
81 -
 82
82 -
 83
83 -
 84
84 -
 85
85 -
 86
86 -
 87
87 -
 88
88 -
 89
89 -
 90
90 -
 91
91 -
 92
92 -
 93
93 -
 94
94 -
95
-
96
-
97
-
98
-
99
-
100
-
101
-
102
-
103
-
104
-
105
-
106
-
107
-
108
-
109
-
110
-
111
-
112
-
113
-
114
-
115
-
116
-
117
-
118
-
119
-
120
-
121
-
122
-
123
-
124
-
125
-
126
-
127
-
128
-
129
-
130
-
131
-
132
-
133
-
134
-
135
-
136
-
137
-
138
-
139
-
140
-
141
-
142
-
143
-
144
-
145
-
146
-
147
-
148
-
149
-
150
-
151
-
152
-
153
-
154
-
155
-
156
-
157
-
158
-
159
-
160
-
161
-
162
-
163
-
164
-
165
-
166
-
167
-
168
-
169
-
170
-
171
-
172
-
173
-
174
-
175
-
176
-
177
-
178
-
179
-
180
-
181
-
182
-
183
-
184
-
185
-
186
-
187
-
188
-
189
-
190
-
191
-
192
-
193
-
194
 |
 |
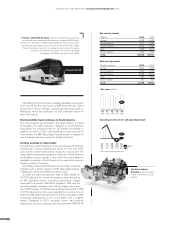
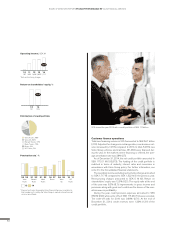
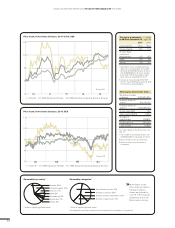
Operating income* and operating margin*
SEK M
%
729
13
626
8.3
14
729
9.4
12
549
7.2
11
825
9.8
10
578
6.6
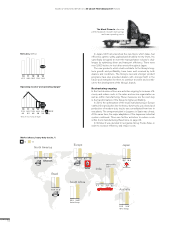
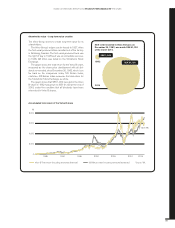
Net sales by market
SEK M 2014 2013
Europe 3,779 3,714
North America 1,584 1,491
South America 386 297
Asia 1,615 1,692
Other markets 425 356
Total 7,790 7,550
Net sales, SEK bn
14
13
121110
7.8
7.6 7.87.68.48.7
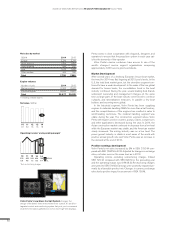
Engine volumes
Number of units 2014 2013
Marine engines117,413 17,427
Industrial engines 15,295 17,651
Total 32,677 35,078
1 Excluding outboard engines.
Penta works in close cooperation with shipyards, designers and
operators to ensure that the propulsion system in each case sat-
isfi es the demands of the operator
Volvo Penta’s marine customers have access to one of the
world’s strongest service support organizations comprising
approximately 4,000 service points worldwide.
Market Development
After several years of a declining European leisure boat market,
the trend for 2014 was fl at, lingering at 2013 year’s levels. In the
U.S. the total boat market grew, but the sterndrive segment con-
tinued to have a weak development. In the wake of the low global
demand for leisure boats, the consolidation trend in the boat
industry continued. During the year, several leading boat brands
underwent ownership and management changes, at the same
time as large parts of the boat industry were forced to continue
cutbacks and rationalization measures. In parallel a few boat
builders are becoming more global.
In the Industrial segment, Volvo Penta has been supplying
engines to materials handling OEMs for more than a half century,
and the competitiveness of the engines has resulted in sales to
world-leading customers. The material handling segment was
stable during the year. The construction segment where Volvo
Penta sell engines used in crushers, pumps, cranes, compressors
and other applications decreased during the year. In 2014, the
Asian construction market continued to decrease from a low level
while the European market was stable, and the American market
slowly increased. The mining industry was on a low level. The
power genset industry is stable in most areas of the world with
positive annual growth rate and Volvo Penta saw an increase in
the demand at the end of 2014.
Positive earnings development
Volvo Penta’s net sales increased by 3% to SEK 7,790 M com-
pared with SEK 7,550 M in 2013. Adjusted for changes in exchange
rates, net sales were on the same level as in 2013.
Operating income excluding restructuring charges totaled
SEK729 M, compared with SEK 626 M in the preceding year
andthe operating margin was 9.4% (8.3). Restructuring charges
amounted to SEK 5 M (0). Earnings were positively impacted pri-
marily by a favorable product mix. Changes in currency exchange
rates had a positive impact in an amount of SEK 155 M.
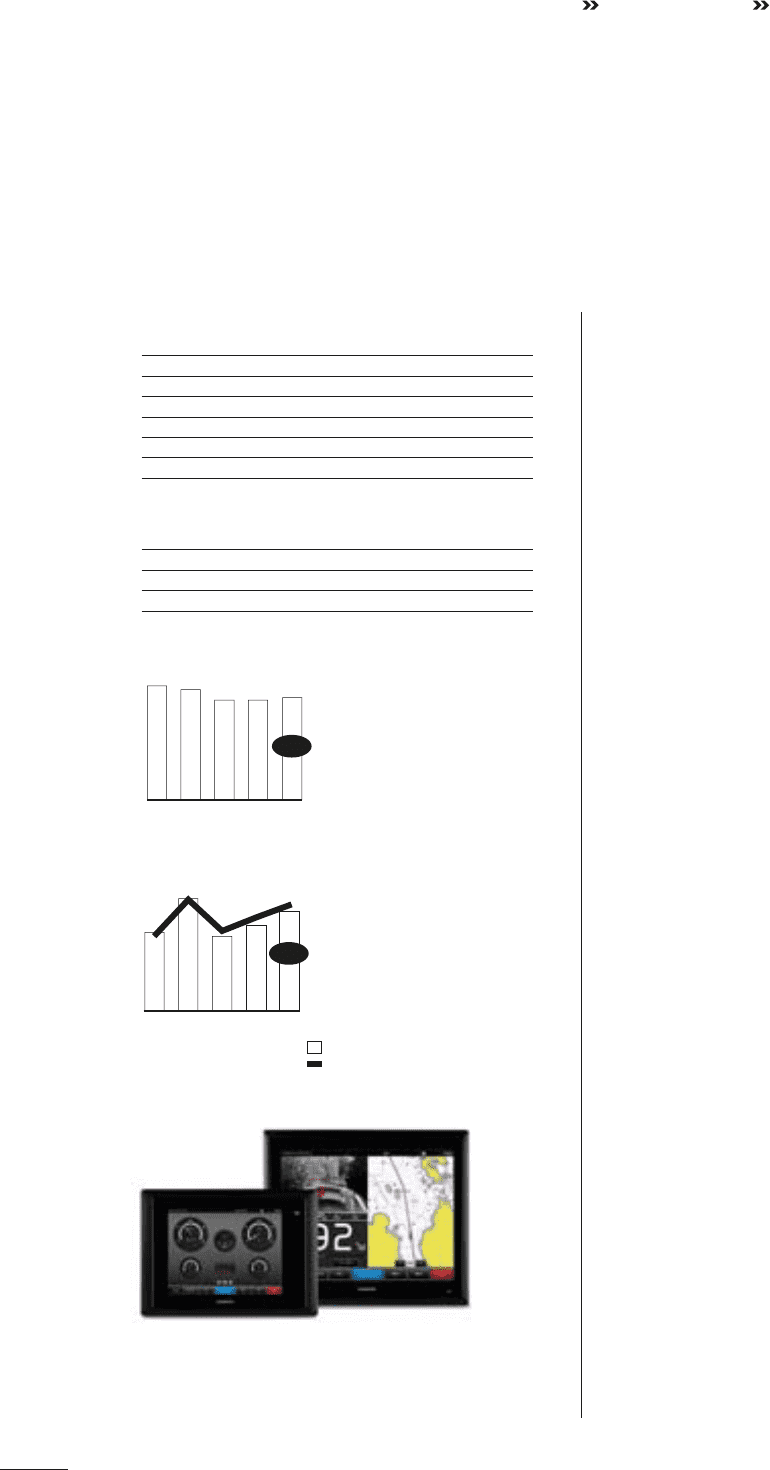
Volvo Penta’s new Glass Cockpit System changes the
design of the boat’s driver environment from scratch. It’s an all-in-
tegrated control and monitoring system that puts you in command
of all the information gathered on one or more high-tech displays.
BOARD OF DIRECTORS’ REPORT 2014 GROUP PERFORMANCE VOLVO PENTA
*Excl. restructuring charges
80