Volvo 2014 Annual Report Download - page 115
Download and view the complete annual report
Please find page 115 of the 2014 Volvo annual report below. You can navigate through the pages in the report by either clicking on the pages listed below, or by using the keyword search tool below to find specific information within the annual report.-
 1
1 -
2
-
3
-
4
-
5
-
6
-
7
-
8
-
9
-
10
-
11
-
12
-
13
-
14
-
15
-
16
-
17
-
18
-
19
-
20
-
21
-
22
-
23
-
24
-
25
-
26
-
27
-
28
-
29
-
30
-
31
-
32
-
33
-
34
-
35
-
36
-
37
-
38
-
39
-
40
-
41
-
42
-
43
-
44
-
45
-
46
-
47
-
48
-
49
-
50
-
51
-
52
-
53
-
54
-
55
-
56
-
57
-
58
-
59
-
60
-
61
-
62
-
63
-
64
-
65
-
66
-
67
-
68
-
69
-
70
-
71
-
72
-
73
-
74
-
75
-
76
-
77
-
78
-
79
-
80
-
81
-
82
-
83
-
84
-
85
-
86
-
87
-
88
-
89
-
90
-
91
-
92
-
93
-
94
-
95
-
96
-
97
-
98
-
99
-
100
-
101
-
102
-
103
-
104
-
 105
105 -
 106
106 -
 107
107 -
 108
108 -
 109
109 -
 110
110 -
 111
111 -
 112
112 -
 113
113 -
 114
114 -
 115
115 -
 116
116 -
 117
117 -
 118
118 -
 119
119 -
 120
120 -
 121
121 -
 122
122 -
 123
123 -
 124
124 -
 125
125 -
126
-
127
-
128
-
129
-
130
-
131
-
132
-
133
-
134
-
135
-
136
-
137
-
138
-
139
-
140
-
141
-
142
-
143
-
144
-
145
-
146
-
147
-
148
-
149
-
150
-
151
-
152
-
153
-
154
-
155
-
156
-
157
-
158
-
159
-
160
-
161
-
162
-
163
-
164
-
165
-
166
-
167
-
168
-
169
-
170
-
171
-
172
-
173
-
174
-
175
-
176
-
177
-
178
-
179
-
180
-
181
-
182
-
183
-
184
-
185
-
186
-
187
-
188
-
189
-
190
-
191
-
192
-
193
-
194
 |
 |

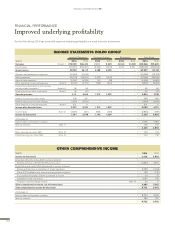
Net sales
Net sales increased by 4% explained mainly by
the 7% sales increase for Trucks business area.
While Buses, Volvo Penta and Customer
Finance also contributed positively, Construc-
tion Equipment experienced a slight decline.
The divestment of Volvo Rents, which was part
of Corporate Functions, Group Functions &
Other segment, on 31 January 2014 contrib-
uted to lower the sales in 2014. Changes in
currency exchange rates mainly related to USD,
EUR and GBP impacted sales positively.
Operating income
Operating income decreased by SEK 1.3 billion
compared to previous year. The positive gross
income impact was offset by costs of non-
recurring nature. The increased gross income
was mainly related to Trucks business areas but
also Bus and Volvo Penta made positive contri-
bution while Construction Equipment had a neg-
ative development compared to previous year.
The operating income was negatively impacted
by the EU antitrust litigation provision of SEK
3.8 billion and provision for expected credit
losses related to credit guarantees in China of
SEK 0.7 billion. Furthermore the provision of
SEK 0.4 billion related to the engine emission
case in US (EPA) and increased cost for restruc-
turing measure of SEK 1.9 billion had a negative
impact on operating income. The capital gain of
SEK 0.8 billion from the divestment of non-stra-
tegic property and SEK 0.2 billion from release
of a provision related to the divesture of Volvo
Rents impacted operating income positively.
The comparable figures for 2013 included a
write down of Volvo Rents of SEK 1.5 billion.
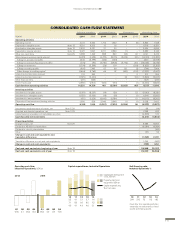
Net financial items
Net interest expense for the Volvo Group
amounted to SEK 1.7 billion compared to SEK
2.4 billion in the preceding year. Interest expenses
decreased due to lower financial liabilities and
lower interest rates on outstanding debt.
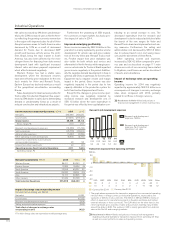
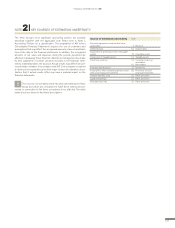
Volvo Group
Net sales by business area, SEK M 2014 2013 %
Trucks 190,904 178,474 7
Construction Equipment 52,855 53,437 (1)
Buses 18,645 16,707 12
Volvo Penta 7,790 7,550 3
Corporate Functions,
Group Functions & Other 8,162 12,410 (34)
Eliminations (2,356) (3,158) (25)
Industrial Operations1275,999 265,420 4
Customer Finance 10 ,111 9,539 6
Reclassifications and eliminations (3,162) (2,336) 35
Volvo Group 282,948 272,622 4
1 Adjusted for acquired and divested units and changes in currency rates, net sales
increased by 2%.
Change in operating income,
SEK bn
Change
(excluding
currency) Currency
impact Total
Operating income 2013 7.1
Change in gross income Industrial Operations 3.2 0.3 3.5
Change in gross income Customer Finance 0.2 0.0 0.2
Lower credit losses
10.1 0.0 0.1
Change in group structure20.1 0.0 0.1
Lower capitalization of development cost (2.3) 0.0 (2.3)
Lower research and development expenditures 0.9 (0.2) 0.7
Lowerselling and administrative expenses 0.9 (0.3) 0.6
Volvo Rents revaluation of assets held for sale
2013and divestment31.7 0.0 1.7
Provision related to EU antitrust investigation (3.7) (0.1) (3.8)
Provision related to engine emission case in the U.S (0.4) 0.0 (0.4)
Provision for expected credit losses for Volvo CE (0.7) 0.0 (0.7)
Divestment of commercial real estate 0.8 0.0 0.8
Restructuringand efficiency program (1.9) 0.0 (1.9)
Other 0.2 (0.1) 0.1
Operating income 2014 5.8
1 Of the lower credit losses SEK 0.1 billion are related to Customer Finance.
2 The net effect on operating income from changes in group structure is SEK
0.1 billion. The gross effect is negative SEK 0.9 billion on gross income, SEK
0.9 billion on selling expenses and SEK 0.1 billion on credit losses.
3 Read more in Note 3 Acquisitions and divestments of shares in sub-
sidiaries.
Operating income (loss) by business area, SEK M 2014 2013
Trucks 4,157 6,145
Construction Equipment 652 2,592
Buses 92 (190)
Volvo Penta 724 626
Corporate Functions, Group Functions & Other (1,689) (3,606)
Eliminations 176 49
Industrial Operations 4,111 5,616
Customer Finance 1,712 1,522
Volvo Group 5,824 7,13 8
Operating margin, % 2014 2013
Trucks 2.2 3.4
Construction Equipment 1.2 4.9
Buses 0.5 (1.1)
Volvo Penta 9.3 8.3
Industrial Operations 1.5 2.1
Volvo Group 2.1 2.6
Net sales, SEK bn
13121110
310265 300
14
273 283
Operating income, SEK M
20142013
Q4
996
Q3
2,398
Q2
3,262
Q1
482
Q4
(2.258)
Q3
2,250
Q2
3,563
Q1
2,269
Other financial income and expense was
positively impacted by SEK 1.1 billion (0.2) from
revaluation of derivatives related to hedging.
Read more in Note 9 Other financial income
and expenses.
Income taxes
The tax expense for the year amounted to SEK
2.9 billion (0.9) corresponding to a tax rate of
56% (20). The high tax rate is mainly explained
by the provision for the EU antitrust litigation
not being tax deductible.
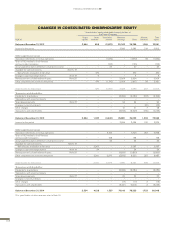
Income for the period and earnings
per share
The income for the period amounted to SEK
2,235 M (3,802), corresponding to diluted earn-
ings per share of SEK 1.03 (1.76). The return on
shareholders’ equity was 2.8% (5).
111
FINANCIAL INFORMATION 2014