Volvo 2014 Annual Report Download - page 176
Download and view the complete annual report
Please find page 176 of the 2014 Volvo annual report below. You can navigate through the pages in the report by either clicking on the pages listed below, or by using the keyword search tool below to find specific information within the annual report.-
 1
1 -
2
-
3
-
4
-
5
-
6
-
7
-
8
-
9
-
10
-
11
-
12
-
13
-
14
-
15
-
16
-
17
-
18
-
19
-
20
-
21
-
22
-
23
-
24
-
25
-
26
-
27
-
28
-
29
-
30
-
31
-
32
-
33
-
34
-
35
-
36
-
37
-
38
-
39
-
40
-
41
-
42
-
43
-
44
-
45
-
46
-
47
-
48
-
49
-
50
-
51
-
52
-
53
-
54
-
55
-
56
-
57
-
58
-
59
-
60
-
61
-
62
-
63
-
64
-
65
-
66
-
67
-
68
-
69
-
70
-
71
-
72
-
73
-
74
-
75
-
76
-
77
-
78
-
79
-
80
-
81
-
82
-
83
-
84
-
85
-
86
-
87
-
88
-
89
-
90
-
91
-
92
-
93
-
94
-
95
-
96
-
97
-
98
-
99
-
100
-
101
-
102
-
103
-
104
-
105
-
106
-
107
-
108
-
109
-
110
-
111
-
112
-
113
-
114
-
115
-
116
-
117
-
118
-
119
-
120
-
121
-
122
-
123
-
124
-
125
-
126
-
127
-
128
-
129
-
130
-
131
-
132
-
133
-
134
-
135
-
136
-
137
-
138
-
139
-
140
-
141
-
142
-
143
-
144
-
145
-
146
-
147
-
148
-
149
-
150
-
151
-
152
-
153
-
154
-
155
-
156
-
157
-
158
-
159
-
160
-
161
-
162
-
163
-
164
-
165
-
 166
166 -
 167
167 -
 168
168 -
 169
169 -
 170
170 -
 171
171 -
 172
172 -
 173
173 -
 174
174 -
 175
175 -
 176
176 -
 177
177 -
 178
178 -
 179
179 -
 180
180 -
 181
181 -
 182
182 -
 183
183 -
 184
184 -
 185
185 -
 186
186 -
187
-
188
-
189
-
190
-
191
-
192
-
193
-
194
 |
 |

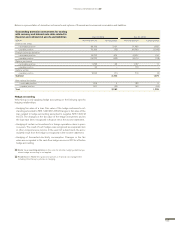
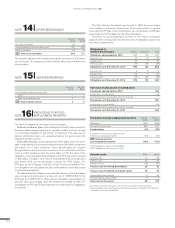
NOTE 13 INVESTMENTS IN SHARES AND PARTICIPATIONS
Intangible assets, acquisition costs Rights Other intangible assets Total intangible assets
Opening balance 2013 52 116 168
Acquisition cost as of Dec 31, 2013 52 116 168
Acquisition cost as of Dec 31, 2014 52 116 168
Intangible assets, accumulated amortization Rights Other intangible assets Total intangible assets
Opening balance 2013152 64 116
Amortization2– 14 14
Accumulated amortization as of Dec 31, 2013152 78 130
Amortization2–1515
Accumulated amortization as of Dec 31, 2014152 93 145
B/S Net value in balance sheet as of Dec 31, 20133–3838
B/S Net value in balance sheet as of Dec 31, 20143–2323
Tangible assets, acquisition costs
Buildings
Land and
improvements
Machinery
and equipment
Construction in
progress, including
advance payments Total tangible assets
Opening balance 2013127 14 42 26 109
Capital Expenditures – – – 37 37
Sales/scrapping – – 0 (37) (37)
Reclassifi cations – – 5 (5) 0
Acquisition cost as of Dec 31, 2013 27 14 47 21 109
Capital Expenditures – – – 28 28
Sales/scrapping (6) (3) 0 (38) (47)
Reclassifi cations – – 0 0 0
Acquisition cost as of Dec 31, 2014 21 11 47 11 90
Tangible assets, accumulated
depreciation Buildings
Land and
improvements
Machinery
and equipment
Construction in
progress, including
advance payments Total tangible assets
Opening balance 2013140 31 – 35
Depreciation210 1 – 2
Sales/scrapping – – 0 – 0
Accumulated depreciation as Dec 31, 2013150 32 – 37
Depreciation210 2 – 3
Sales/scrapping (3) – (1) – (4)
Accumulated depreciation as of Dec 31, 2014130 33 – 36
B/S Net value in balance sheet as of Dec 31, 2013322 14 15 21 72
B/S Net value in balance sheet as of Dec 31, 2014318 11 14 11 5 4
1 Including accumulated write-downs.
2 Including write-downs.
3 Acquisition value, less accumulated depreciation, amortization and write-downs.
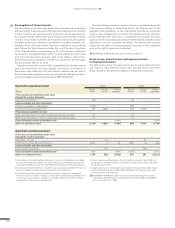
NOTE 12 INTANGIBLE AND TANGIBLE ASSETS
AB Volvo owns, directly or indirectly, 294 (310) legal entities. The legal
structure is designed to effectively manage legal requirements, adminis-
tration and taxes, as well as the operations conducted by the Group in
each country it operates. Legal entities may have different characters and
include different types of operations, such as production, development
and sales. The character of a legal entity may change over time. Further-
more legal entities could include different type of the Group’s operations
and this could also change over time. In some countries there are legal
restrictions which limit the Group’s ability to transfer assets between the
Group’s legal entities. Read more in the Note 18 Marketable securities
and liquid funds in the consolidated fi nancial statements for a description
of restrictions related to cash and cash equivalents.
Volvo Group’s operational structure gives a better overview of how the
Volvo Group has chosen to organize its business. Read more about Volvo
Group’s operational structure in Note 6 Segment Reporting in the consol-
idated fi nancial statements.
FINANCIAL INFORMATION 2014
172