Volvo 2014 Annual Report Download - page 135
Download and view the complete annual report
Please find page 135 of the 2014 Volvo annual report below. You can navigate through the pages in the report by either clicking on the pages listed below, or by using the keyword search tool below to find specific information within the annual report.-
 1
1 -
2
-
3
-
4
-
5
-
6
-
7
-
8
-
9
-
10
-
11
-
12
-
13
-
14
-
15
-
16
-
17
-
18
-
19
-
20
-
21
-
22
-
23
-
24
-
25
-
26
-
27
-
28
-
29
-
30
-
31
-
32
-
33
-
34
-
35
-
36
-
37
-
38
-
39
-
40
-
41
-
42
-
43
-
44
-
45
-
46
-
47
-
48
-
49
-
50
-
51
-
52
-
53
-
54
-
55
-
56
-
57
-
58
-
59
-
60
-
61
-
62
-
63
-
64
-
65
-
66
-
67
-
68
-
69
-
70
-
71
-
72
-
73
-
74
-
75
-
76
-
77
-
78
-
79
-
80
-
81
-
82
-
83
-
84
-
85
-
86
-
87
-
88
-
89
-
90
-
91
-
92
-
93
-
94
-
95
-
96
-
97
-
98
-
99
-
100
-
101
-
102
-
103
-
104
-
105
-
106
-
107
-
108
-
109
-
110
-
111
-
112
-
113
-
114
-
115
-
116
-
117
-
118
-
119
-
120
-
121
-
122
-
123
-
124
-
 125
125 -
 126
126 -
 127
127 -
 128
128 -
 129
129 -
 130
130 -
 131
131 -
 132
132 -
 133
133 -
 134
134 -
 135
135 -
 136
136 -
 137
137 -
 138
138 -
 139
139 -
 140
140 -
 141
141 -
 142
142 -
 143
143 -
 144
144 -
 145
145 -
146
-
147
-
148
-
149
-
150
-
151
-
152
-
153
-
154
-
155
-
156
-
157
-
158
-
159
-
160
-
161
-
162
-
163
-
164
-
165
-
166
-
167
-
168
-
169
-
170
-
171
-
172
-
173
-
174
-
175
-
176
-
177
-
178
-
179
-
180
-
181
-
182
-
183
-
184
-
185
-
186
-
187
-
188
-
189
-
190
-
191
-
192
-
193
-
194
 |
 |

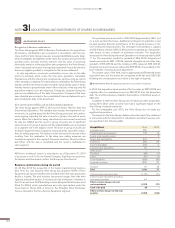
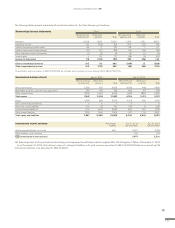
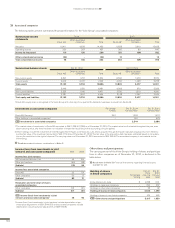
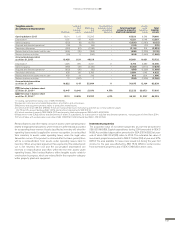
The following tables present summarized fi nancial information for the Volvo Group’s joint ventures:
Summarized income statements 2014 2013
VE Commercial
Vehicles, Ltd. Other joint
ventures Total VE Commercial
Vehicles, Ltd. Other joint
ventures Total
Net sales 6,208 2,622 8,830 5,516 1,291 6,807
Operating income
182 (134) (52) 230 (52) 178
Interest income and similar credits 26 2 28 60 1 61
Interest expense and similar charges (13) (71) (84) (10) (39) (49)
Other fi nancial income and expenses (1) (3) (4) (2) (1) (3)
Income taxes 4 23 27 (48) (5) (53)
Income for the period 98 (183) (85) 230 (96) 134
Other comprehensive income 415 50 465 (298) 12 (286)
Total comprehensive income 513 (133) 380 (68) (84) (152)
1 Depreciation and amortization of SEK 303 M (138) are included within operating income whereof VECV SEK 273 M (115).
Summarized balance sheets Dec 31, 2014 Dec 31, 2013
VE Commercial
Vehicles, Ltd. Other joint
ventures Total VE Commercial
Vehicles, Ltd. Other joint
ventures Total
Non-current assets 5,083 553 5,636 4,336 448 4,784
Marketable securities, cash and cash equivalents 519 189 708 669 87 756
Other current assets 2,245 2,264 4,509 1,699 1,884 3,583
Total assets 7,847 3,00 6 10, 853 6,704 2,419 9,123
Equity 4,754 266 5,020 4,318 400 4,718
Non-current fi nancial liabilities 7 0 7 6 – 6
Other non-currentliabilities 721 30 751 574 8 582
Current fi nancial liabilities 1,115 1,445 2,560 835 901 1,736
Other current liabilities 1,250 1,265 2,515 971 1,110 2,081
Total equity and liabilities 7,8 47 3 ,006 10,8 53 6 ,704 2 ,419 9,123
Investments in joint ventures Percentage
holding Dec 31, 2014
Carrying value Dec 31, 2013
Carrying value
VE Commercial Vehicles., Ltd., India 45.6 2,377 2,189
Other holdings in joint ventures –100102
B/S Investments in joint ventures 2,477 2,291
Net fi nancial position for the joint ventures (excluding post-employment benefi ts) amounted to negative SEK 744 M (negative 149) as of December 31, 2014.
As of December 31, 2014, Volvo Group’s share of contingent liabilities in its joint ventures amounted to SEK 106 M (62). Dividend received from VE
Commercial Vehicles., Ltd, amounted to SEK 36 M (41).
131
FINANCIAL INFORMATION 2014