Volvo 2014 Annual Report Download - page 29
Download and view the complete annual report
Please find page 29 of the 2014 Volvo annual report below. You can navigate through the pages in the report by either clicking on the pages listed below, or by using the keyword search tool below to find specific information within the annual report.-
 1
1 -
2
-
3
-
4
-
5
-
6
-
7
-
8
-
9
-
10
-
11
-
12
-
13
-
14
-
15
-
16
-
17
-
18
-
 19
19 -
 20
20 -
 21
21 -
 22
22 -
 23
23 -
 24
24 -
 25
25 -
 26
26 -
 27
27 -
 28
28 -
 29
29 -
 30
30 -
 31
31 -
 32
32 -
 33
33 -
 34
34 -
 35
35 -
 36
36 -
 37
37 -
 38
38 -
 39
39 -
40
-
41
-
42
-
43
-
44
-
45
-
46
-
47
-
48
-
49
-
50
-
51
-
52
-
53
-
54
-
55
-
56
-
57
-
58
-
59
-
60
-
61
-
62
-
63
-
64
-
65
-
66
-
67
-
68
-
69
-
70
-
71
-
72
-
73
-
74
-
75
-
76
-
77
-
78
-
79
-
80
-
81
-
82
-
83
-
84
-
85
-
86
-
87
-
88
-
89
-
90
-
91
-
92
-
93
-
94
-
95
-
96
-
97
-
98
-
99
-
100
-
101
-
102
-
103
-
104
-
105
-
106
-
107
-
108
-
109
-
110
-
111
-
112
-
113
-
114
-
115
-
116
-
117
-
118
-
119
-
120
-
121
-
122
-
123
-
124
-
125
-
126
-
127
-
128
-
129
-
130
-
131
-
132
-
133
-
134
-
135
-
136
-
137
-
138
-
139
-
140
-
141
-
142
-
143
-
144
-
145
-
146
-
147
-
148
-
149
-
150
-
151
-
152
-
153
-
154
-
155
-
156
-
157
-
158
-
159
-
160
-
161
-
162
-
163
-
164
-
165
-
166
-
167
-
168
-
169
-
170
-
171
-
172
-
173
-
174
-
175
-
176
-
177
-
178
-
179
-
180
-
181
-
182
-
183
-
184
-
185
-
186
-
187
-
188
-
189
-
190
-
191
-
192
-
193
-
194
 |
 |

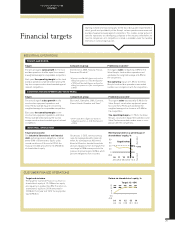
Financial targets
INDUSTRIAL OPERATIONS
12.5
12
12.5
14
12.1
13
(10)
0
0.4
10
7.3
11
15
10
5
(5)
Target: 12−15%
Return on shareholders’ equity, %
CUSTOMER FINANCE OPERATIONS
Target and outcome
The target for Customer Finance is a return on
shareholders’ equity of 12–15% and an equity
ratio equal to or greater than 8%. The return on
shareholders’ equity for 2014 amounted to
12.5% (12.1). At year end 2014 the equity ratio
was 8.0% (8.1).
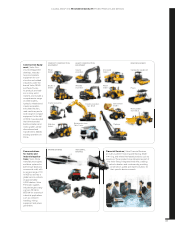
CONSTRUCTION EQUIPMENT AND VOLVO PENTA
Target Comparison group Preliminary outcome*
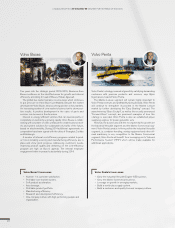
The annual organic sales growth for the
construction equipment operations and
Volvo Penta, shall be equal to or exceed a
weighted-average for comparable competitors.
Each year, the operating margin for the
construction equipment operations and Volvo
Penta, shall be ranked among the top two
companies when benchmarked against relevant
competitors.
Brunswick, Caterpillar, CNH, Cummins,
Deere, Hitachi, Komatsu and Terex.*
* Deere’s and Terex’s fi gures are based on
rolling four quarters as of the third quarter
of 2014.
The organic sales decreased by 5.1% for the
Volvo Group’s construction equipment opera-
tions and Volvo Penta and was below the
weighted average of an increase of 3.6% for
the competitors.
The operating margin of 1.7% for the Volvo
Group’s construction equipment operations and
Volvo Penta was ranked number seven in com-
parison with the competitors.
Target Comparison group Preliminary outcome*
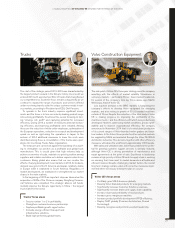
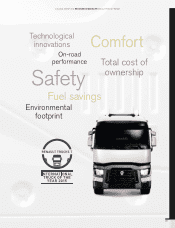
The annual organic sales growth for the truck
and bus operations shall be equal to or exceed
a weighted-average for comparable competitors.
Each year, the operating margin for the truck
and bus operations shall be ranked among the
top two companies when benchmarked against
relevant competitors.
Daimler, Iveco, MAN, Navistar, Paccar,
Scania and Sinotruk.*
* Navistar’s and MAN’s fi gures are based on
rolling four quarters as of the third quarter
of 2014 and Sinotruk’s fi gures are based on
rolling four quarters as of the second quarter
of 2014.
The organic sales increased by 3.6% for the
Volvo Group’s truck and bus operations and
was below the weighted average of 3.8% for
the competitors.
The operating margin of 1.4% for the Volvo
Group’s truck and bus operations was ranked
number six in comparison with the competitors.
TRUCKS AND BUSES
29.3
12
14.2
14
29.0
13
0
(
20)
37.4
10
25.2
11
40
20
80
60
Net cash Net debt
Target below:
35%
40%
Net fi nancial debt as a percentage of
shareholders’ equity, %
Target and outcome
The Industrial Operations’ net fi nancial
debt, excluding pension obligations, shall be
below 35% of shareholders’ equity under
normal conditions. At the end of 2014, the
fi nancial net debt amounted to 14.2% (29.0)
of shareholders’ equity.
INDUSTRIAL OPERATIONS
On January 1, 2013, new accounting
rules for employee benefi ts came into
effect. As a consequence, AB Volvo’s
Board of Directors decided to exclude
pension obligations from the target. The
new target of 35% corresponds to the
previous fi nancial target of 40% in which
pension obligations were included.
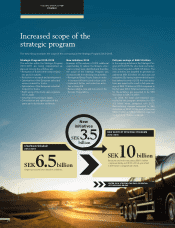
Starting in 2012 new fi nancial targets for the Volvo Group were implemented in
which growth and profi tability of the Group’s various operations are measured
and benchmarked annually against competitors. This creates a clear picture of
how the operations are developing compared to the industry. Information on
how the comparison with competitors is made is available under the heading
Investors on www.volvogroup.com.
A GLOBAL GROUP 2014
STRATEGY
25