Volvo 2014 Annual Report Download - page 86
Download and view the complete annual report
Please find page 86 of the 2014 Volvo annual report below. You can navigate through the pages in the report by either clicking on the pages listed below, or by using the keyword search tool below to find specific information within the annual report.-
 1
1 -
2
-
3
-
4
-
5
-
6
-
7
-
8
-
9
-
10
-
11
-
12
-
13
-
14
-
15
-
16
-
17
-
18
-
19
-
20
-
21
-
22
-
23
-
24
-
25
-
26
-
27
-
28
-
29
-
30
-
31
-
32
-
33
-
34
-
35
-
36
-
37
-
38
-
39
-
40
-
41
-
42
-
43
-
44
-
45
-
46
-
47
-
48
-
49
-
50
-
51
-
52
-
53
-
54
-
55
-
56
-
57
-
58
-
59
-
60
-
61
-
62
-
63
-
64
-
65
-
66
-
67
-
68
-
69
-
70
-
71
-
72
-
73
-
74
-
75
-
 76
76 -
 77
77 -
 78
78 -
 79
79 -
 80
80 -
 81
81 -
 82
82 -
 83
83 -
 84
84 -
 85
85 -
 86
86 -
 87
87 -
 88
88 -
 89
89 -
 90
90 -
 91
91 -
 92
92 -
 93
93 -
 94
94 -
 95
95 -
 96
96 -
97
-
98
-
99
-
100
-
101
-
102
-
103
-
104
-
105
-
106
-
107
-
108
-
109
-
110
-
111
-
112
-
113
-
114
-
115
-
116
-
117
-
118
-
119
-
120
-
121
-
122
-
123
-
124
-
125
-
126
-
127
-
128
-
129
-
130
-
131
-
132
-
133
-
134
-
135
-
136
-
137
-
138
-
139
-
140
-
141
-
142
-
143
-
144
-
145
-
146
-
147
-
148
-
149
-
150
-
151
-
152
-
153
-
154
-
155
-
156
-
157
-
158
-
159
-
160
-
161
-
162
-
163
-
164
-
165
-
166
-
167
-
168
-
169
-
170
-
171
-
172
-
173
-
174
-
175
-
176
-
177
-
178
-
179
-
180
-
181
-
182
-
183
-
184
-
185
-
186
-
187
-
188
-
189
-
190
-
191
-
192
-
193
-
194
 |
 |

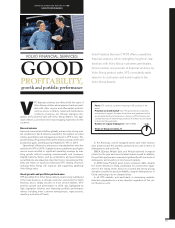
BOARD OF DIRECTORS’ REPORT GROUP PERFORMANCE VOLVO FINANCIAL SERVICES
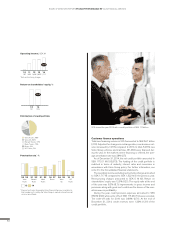
Operating income*, SEK M
13
1,522
14
1,717
12
1,496
11
969
10
167
1,717
Return on shareholders’ equity, %
14
12.5
13
12.1
12.5
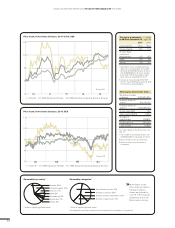
Distribution of credit portfolio
Volvo Trucks, 48%
Volvo CE, 23%
Renault Trucks, 10%
Mack Trucks, 12%
Buses, 5%
UD Trucks, 2%
Penetration rate*, %
3030
Volvo
Trucks
Renault
Trucks
Mack
Trucks
Buses Volvo
CE
UD
Trucks
2321 2321 2716 3936 1112
13 14
* Share of unit sales fi nanced by Volvo Financial Services in relation to
total number units sold by the Volvo Group in markets where fi nancial
services are offered.
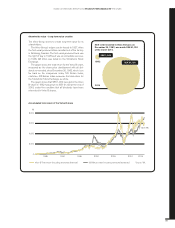
Customer fi nance operations
Total new fi nancing volume in 2014 amounted to SEK 54.7 billion
(47.0). Adjusted for changes in exchange rates, new business vol-
ume increased by 13.5% compared to 2013. In total, 54,819 new
Volvo Group vehicles and machines (51,466) were fi nanced dur-
ing the year. In the markets where fi nancing is offered, the aver-
age penetration rate was 28% (27).
As of December 31, 2014, the net credit portfolio amounted to
SEK 117,101 M (103,873). The funding of the credit portfolio is
matched in terms of maturity, interest rates and currencies in
accordance with Volvo Group policy. For further information, see
note 4 to the Consolidated fi nancial statements.
The operating income excluding restructuring charges amounted
to SEK 1,717 M compared to SEK 1,522 M in the previous year.
Restructuring charges amounted to SEK 5 M (0). Return on
shareholders’ equity was 12.5% (12.1). The equity ratio at the end
of the year was 8.0% (8.1). Improvements in gross income and
provisions along with good cost control are the drivers of the over-
all increase in profi tability.
During the year, credit provision expenses amounted to SEK
858 M (923) while write-offs of SEK 715 M (719) were recorded.
The write-off ratio for 2014 was 0.66% (0.71). At the end of
December 31, 2014, credit reserves were 1.33% (1.31) of the
credit portfolio.
VFS closed the year 2014 with a credit portfolio of SEK 117 billion.
*Excl. restructuring charges
82