Volvo 2014 Annual Report Download - page 189
Download and view the complete annual report
Please find page 189 of the 2014 Volvo annual report below. You can navigate through the pages in the report by either clicking on the pages listed below, or by using the keyword search tool below to find specific information within the annual report.-
 1
1 -
2
-
3
-
4
-
5
-
6
-
7
-
8
-
9
-
10
-
11
-
12
-
13
-
14
-
15
-
16
-
17
-
18
-
19
-
20
-
21
-
22
-
23
-
24
-
25
-
26
-
27
-
28
-
29
-
30
-
31
-
32
-
33
-
34
-
35
-
36
-
37
-
38
-
39
-
40
-
41
-
42
-
43
-
44
-
45
-
46
-
47
-
48
-
49
-
50
-
51
-
52
-
53
-
54
-
55
-
56
-
57
-
58
-
59
-
60
-
61
-
62
-
63
-
64
-
65
-
66
-
67
-
68
-
69
-
70
-
71
-
72
-
73
-
74
-
75
-
76
-
77
-
78
-
79
-
80
-
81
-
82
-
83
-
84
-
85
-
86
-
87
-
88
-
89
-
90
-
91
-
92
-
93
-
94
-
95
-
96
-
97
-
98
-
99
-
100
-
101
-
102
-
103
-
104
-
105
-
106
-
107
-
108
-
109
-
110
-
111
-
112
-
113
-
114
-
115
-
116
-
117
-
118
-
119
-
120
-
121
-
122
-
123
-
124
-
125
-
126
-
127
-
128
-
129
-
130
-
131
-
132
-
133
-
134
-
135
-
136
-
137
-
138
-
139
-
140
-
141
-
142
-
143
-
144
-
145
-
146
-
147
-
148
-
149
-
150
-
151
-
152
-
153
-
154
-
155
-
156
-
157
-
158
-
159
-
160
-
161
-
162
-
163
-
164
-
165
-
166
-
167
-
168
-
169
-
170
-
171
-
172
-
173
-
174
-
175
-
176
-
177
-
178
-
 179
179 -
 180
180 -
 181
181 -
 182
182 -
 183
183 -
 184
184 -
 185
185 -
 186
186 -
 187
187 -
 188
188 -
 189
189 -
 190
190 -
 191
191 -
 192
192 -
 193
193 -
 194
194
 |
 |

FINANCIAL INFORMATION 2014
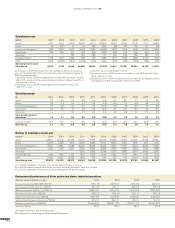
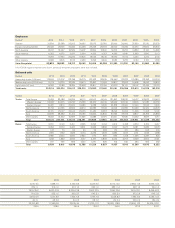
Business area statistics
Net sales1
SEK M 2014 2013 2012 2011 2010 2009 2008 2007 2006 2005 2004
Trucks Europe 72,757 73,640 76,365 83,451 69,606 65,874 109,914 108,651 93,282 79,706 77,431
North America 53,696 40,314 42,650 37,042 26,901 21,563 26,588 27,255 50,605 46,129 35,154
South America 19,669 23,318 21,172 26,847 21,680 12,490 14,680 11,483 9,213 7,657 5,223
Asia 29,264 26,740 36,531 37,840 35,231 26,943 37,515 26,593 8,975 13,551 12,378
Other markets 15,518 14,462 15,565 13,741 13, 887 12,069 14,538 13,910 9,190 8,353 6,693
Total 190,904 178,474 192,283 198,920 167,305 138,940 203,235 187,892 171,265 155,396 136,879
Buses Europe 6,139 5,429 6,200 6,631 6,242 7,707 7,321 7,767 7,924 7,142 6,948
North America 6,721 5,929 6,675 7,532 7,200 5,673 5,355 4,630 4,910 4,247 2,960
South America 2,559 1,836 2,794 2,715 1,737 1,235 1,571 1,623 1,537 2,641 521
Asia 1,892 2,055 2,853 2,953 3,299 2,749 2,094 1,802 2,003 1,612 1,632
Other markets 1,334 1,457 1,774 1,992 2,038 1,101 971 786 897 947 661
Total 18,645 16,707 20,295 21,823 20,516 18,465 17,312 16,608 17,271 16,589 12,722
Construction Europe 17,215 16,356 16,518 17,765 16,138 12,987 25,192 25,294 20,326 15,524 13,453
Equipment North America 10,784 8,319 12,027 7,829 6,267 5,475 10,159 11,170 11,280 10,337 8,601
South America 3,234 3,314 3,788 4,163 4,130 2,578 2,913 2,155 1,358 1,238 922
Asia 18,458 21,911 27,033 29,999 24,352 12,957 13,738 12,179 6,903 5,717 4,961
Other markets 3,164 3,539 4,192 3,745 2,923 1,661 4,077 2,835 2,264 2,000 1,423
Total 52,855 53,437 63,558 63,500 53,810 35,658 56,079 53,633 42,131 34,816 29,360
Volvo Penta Europe 3,779 3,714 3,620 4,274 4,507 4,390 6,554 6,798 6,111 5,102 4,907
North America 1,584 1,491 1,486 1,379 1,500 1,100 1,947 2,674 2,815 2,832 2,500
South America 386 297 306 335 335 284 364 274 221 208 142
Asia 1,615 1,692 1,867 2,130 2,008 2,054 2,082 1,624 1,359 1,427 1,324
Other markets 425 356 352 341 366 331 486 349 268 207 184
Total 7,790 7,550 7,6 31 8 ,458 8,716 8,159 11,433 11,719 10,774 9,776 9,057
Volvo Aero Europe – – 2,404 2,893 3,768 3,942 3,497 3,462 3,798 3,406 3,179
North America – – 2,657 3,300 3,599 3,508 3,534 3,723 3,815 3,612 3,127
South America – – 0 7 27 34 58 127 173 168 138
Asia – – 109 104 233 205 234 234 356 284 400
Other markets – – 49 52 81 114 125 100 91 68 81
Tot al – – 5, 219 6 ,356 7,70 8 7, 803 7,448 7,646 8,233 7,538 6, 925
Other and
eliminations 5,806 9,252 7,044 4,532 (680) (538) (575) (703) (654) 7,076 7,228
Net sales Industrial
Operations 275,999 265,420 296,031 303,589 257,375 208,487 294,932 276,795 249,020 231,191 202,171
Customer Europe 5,120 4,686 4,703 4,663 4,733 7,127 7,099 4,484 4,388 4,797 6,613
Finance North America 2,999 2,900 2,833 2,326 2,605 3,004 369 2,467 2,569 2,036 2,432
South America 1,122 1,009 1,195 1,131 1,156 1,070 791 620 608 570 396
Asia 638 707 795 571 435 435 158 87 45 101 90
Other markets 232 237 257 192 101 75 68 47 38 45 67
Total 10,111 9, 539 9,78 3 8 , 8 8 3 9, 031 11,711 8 , 4 8 5 7,705 7, 6 4 8 7,549 9, 598
Eliminations (3,162) (2,336) (2,167) (2,104) (1,658) (1,836) 250 905 2,167 1,819 (693)
Volvo Group total 282,948 272,622 303,647 310,367 264,749 218,361 303,667 285,405 258,835 240,559 211,076
1 As of January 1, 2007, the results from the synergies created in the business
units are transferred back to the various business areas.
Comparison fi gures for 2006 have been restated.
Volvo Aero was divested in October 1, 2012.
185