Volvo 2014 Annual Report Download - page 137
Download and view the complete annual report
Please find page 137 of the 2014 Volvo annual report below. You can navigate through the pages in the report by either clicking on the pages listed below, or by using the keyword search tool below to find specific information within the annual report.-
 1
1 -
2
-
3
-
4
-
5
-
6
-
7
-
8
-
9
-
10
-
11
-
12
-
13
-
14
-
15
-
16
-
17
-
18
-
19
-
20
-
21
-
22
-
23
-
24
-
25
-
26
-
27
-
28
-
29
-
30
-
31
-
32
-
33
-
34
-
35
-
36
-
37
-
38
-
39
-
40
-
41
-
42
-
43
-
44
-
45
-
46
-
47
-
48
-
49
-
50
-
51
-
52
-
53
-
54
-
55
-
56
-
57
-
58
-
59
-
60
-
61
-
62
-
63
-
64
-
65
-
66
-
67
-
68
-
69
-
70
-
71
-
72
-
73
-
74
-
75
-
76
-
77
-
78
-
79
-
80
-
81
-
82
-
83
-
84
-
85
-
86
-
87
-
88
-
89
-
90
-
91
-
92
-
93
-
94
-
95
-
96
-
97
-
98
-
99
-
100
-
101
-
102
-
103
-
104
-
105
-
106
-
107
-
108
-
109
-
110
-
111
-
112
-
113
-
114
-
115
-
116
-
117
-
118
-
119
-
120
-
121
-
122
-
123
-
124
-
125
-
126
-
 127
127 -
 128
128 -
 129
129 -
 130
130 -
 131
131 -
 132
132 -
 133
133 -
 134
134 -
 135
135 -
 136
136 -
 137
137 -
 138
138 -
 139
139 -
 140
140 -
 141
141 -
 142
142 -
 143
143 -
 144
144 -
 145
145 -
 146
146 -
 147
147 -
148
-
149
-
150
-
151
-
152
-
153
-
154
-
155
-
156
-
157
-
158
-
159
-
160
-
161
-
162
-
163
-
164
-
165
-
166
-
167
-
168
-
169
-
170
-
171
-
172
-
173
-
174
-
175
-
176
-
177
-
178
-
179
-
180
-
181
-
182
-
183
-
184
-
185
-
186
-
187
-
188
-
189
-
190
-
191
-
192
-
193
-
194
 |
 |

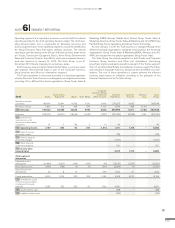
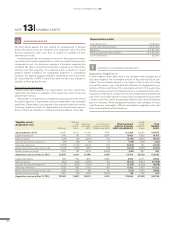
Operating segments are reported in a manner consistent with the internal
reporting provided to the chief operating decision-maker. The chief oper-
ating decision-maker, who is responsible for allocating resources and
assessing performance of the operating segments, has been identifi ed as
the Group Executive Team that makes strategic decisions. The internal
reporting is provided based on the Group’s different business areas which
are Trucks, Construction Equipment, Buses, Volvo Penta, Governmental
Sales and Customer Finance. Volvo Rents, which was a separate business
area, was divested on January 31, 2014. The Volvo Group is per 31
December 2014 thereby organized in six business areas.
Each business area, except for Governmental Sales, is seen as a sepa-
rate segment. Governmental Sales is part of the Corporate functions,
Group functions and Other incl. eliminations segment.
The Trucks operations is structured according to a functional approach,
whereby the entire Trucks business is managed as one single business area
consisting of fi ve different functional organizations: Group Trucks Sales &
Marketing EMEA (Europe, Middle East, Africa), Group Trucks Sales &
Marketing Americas, Group Trucks Sales & Marketing and JV’s APAC (Asia
Pacifi c), Group Trucks Operations and Group Trucks Technology.
As from January 1, 2015 the Truck business is managed through three
different functional organizations compared to the previous fi ve functional
organizations. Group Trucks Sales & Marketing EMEA, Americas and JV’s
APAC are merged into one global organization, Group Trucks Sales.
The Volvo Group has shared operations in both Trucks and Corporate
functions, Group functions and Other incl. eliminations. Purchasing,
powertrain, logistics and parts operations are part of the Trucks segment.
Volvo IT and Volvo Real Estate are treated as business support functions
and included in Corporate functions, Group functions and Other incl. elim-
inations. The cost of these operations is shared between the different
business areas based on utilization according to the principles of the
fi nancial framework set by the Volvo Group.
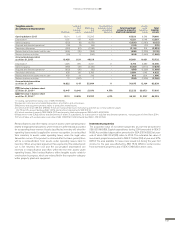
2014 Trucks Con struction
Equipment Buses Volvo Penta
Corporate
functions, Group
functions &
Other incl. elim. Industrial
Operations Customer
Finance Elimina-
tions Volvo
Group
Net sales, external
customers 188,079 52,641 18,159 7,541 6,906 273,327 9,623 – 282,948
Net sales, internal 2,825 215 486 249 (1,101) 2,674 488 (3,162) –
I/S Net sales 190,904 52,855 18,645 7,790 5,805 275,999 10,111 (3,162) 282,948
Expenses (186,777) (52,211) (18,544) (7,067) (7,333) (271,934) (8,399) 3,162 (277,170)
I/S Income from
investments in joint
ventures and associated
companies 31 7 (8) 2 14 46 – – 46
I/S Operating income 4,157 652 92 724 (1,514) 4,111 1,712 – 5,824
I/S Interest income
and similar credits 328 – – 328
I/S Interest expense
and similar charges (1,994) – – (1,994)
I/S Other fi nancial
income and expense 931 – – 931
I/S Income after
fi nancial items 3,377 1,712 – 5,089
Other segment
information
Depreciation and
amor tization (10,499) (2,017) (343) (267) 453 (12,673) (3,257) – (15,930)
Restructuring costs (1,465) (582) (9) (5) (504) (2,564) (7) – (2,571)
Gains/losses from
divestments 23 8 15 – 956 1,002 21 – 1,023
Capital expenditure 6,500 1,335 290 308 1,084 9,518 9,677 – 19,195
B/S Investments in joint
ventures and associated
companies (the equity
method) 2,583 250 220 30 1,739 4,821 – – 4,821
B/S Assets held for sale 288 – – 288
B/S Liabilities held for sale (130) – – (130)
NOTE 6 SEGMENT REPORTING
FINANCIAL INFORMATION 2014
133