Volvo 2014 Annual Report Download - page 5
Download and view the complete annual report
Please find page 5 of the 2014 Volvo annual report below. You can navigate through the pages in the report by either clicking on the pages listed below, or by using the keyword search tool below to find specific information within the annual report.-
 1
1 -
 2
2 -
 3
3 -
 4
4 -
 5
5 -
 6
6 -
 7
7 -
 8
8 -
 9
9 -
 10
10 -
 11
11 -
 12
12 -
 13
13 -
 14
14 -
 15
15 -
 16
16 -
17
-
18
-
19
-
20
-
21
-
22
-
23
-
24
-
25
-
26
-
27
-
28
-
29
-
30
-
31
-
32
-
33
-
34
-
35
-
36
-
37
-
38
-
39
-
40
-
41
-
42
-
43
-
44
-
45
-
46
-
47
-
48
-
49
-
50
-
51
-
52
-
53
-
54
-
55
-
56
-
57
-
58
-
59
-
60
-
61
-
62
-
63
-
64
-
65
-
66
-
67
-
68
-
69
-
70
-
71
-
72
-
73
-
74
-
75
-
76
-
77
-
78
-
79
-
80
-
81
-
82
-
83
-
84
-
85
-
86
-
87
-
88
-
89
-
90
-
91
-
92
-
93
-
94
-
95
-
96
-
97
-
98
-
99
-
100
-
101
-
102
-
103
-
104
-
105
-
106
-
107
-
108
-
109
-
110
-
111
-
112
-
113
-
114
-
115
-
116
-
117
-
118
-
119
-
120
-
121
-
122
-
123
-
124
-
125
-
126
-
127
-
128
-
129
-
130
-
131
-
132
-
133
-
134
-
135
-
136
-
137
-
138
-
139
-
140
-
141
-
142
-
143
-
144
-
145
-
146
-
147
-
148
-
149
-
150
-
151
-
152
-
153
-
154
-
155
-
156
-
157
-
158
-
159
-
160
-
161
-
162
-
163
-
164
-
165
-
166
-
167
-
168
-
169
-
170
-
171
-
172
-
173
-
174
-
175
-
176
-
177
-
178
-
179
-
180
-
181
-
182
-
183
-
184
-
185
-
186
-
187
-
188
-
189
-
190
-
191
-
192
-
193
-
194
 |
 |
1
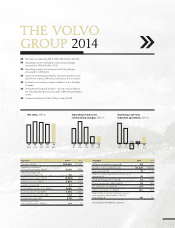
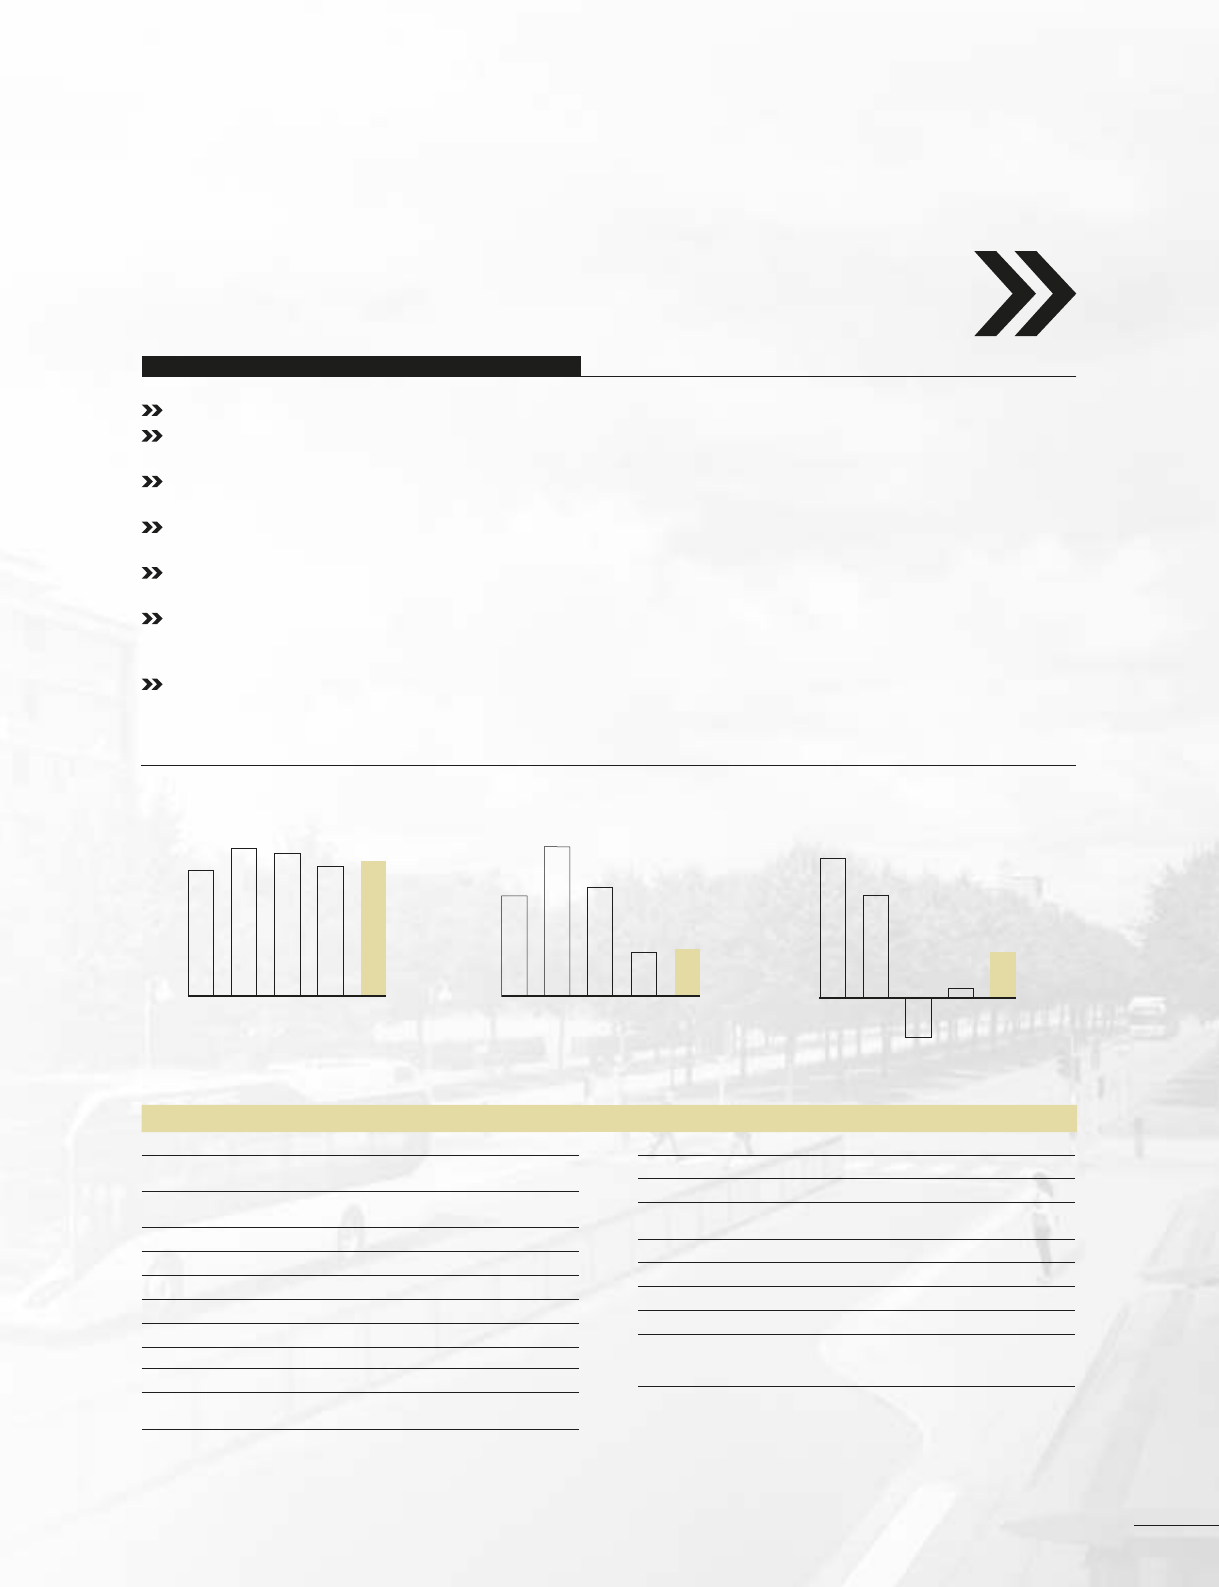
Net sales increased by 4% to SEK 282.9 billion (272.6).
Operating income excluding restructuring charges
amounted to SEK 8.4 billion (7.9).
Operating margin excluding restructuring charges
amounted to 3.0% (2.9).
Improved underlying profi tability with good traction in the
activities to improve effi ciency and reduce the cost base.
Increased cost-savings scope in addition to the Strategic
Program.
Strengthened fi nancial position – at year end net debt in
the Industrial Operations amounted to 14% of shareholders’
equity.
Proposed dividend of SEK 3.00 per share (3.00).
Net sales, SEK bn
13 14121110
273 283300310265
Operating income excl.
restructuring charges, SEK bn
1110
26.918.0
13
7.9
14
8.4
12
19.6
Operating cash fl ow,
Industrial operations, SEK bn
1413121110
6.41.5
(4.9)
14.119.0
THE VOLVO
GROUP 2014
Net sales, SEK M 282,948 272,622
Operating income excl.
restructuring charges, SEK M 8,393 7,854
Operating margin excl.
restructuring charges, % 3.0 2.9
Restructuring charges,SEK M (2,569) (715)
Operating income, SEK M 5,824 7,138
Operating margin, % 2.1 2.6
Income after fi nancial items, SEK M 5,089 4,721
Income for the period, SEK M 2,235 3,802
Diluted earnings per share, SEK 1.03 1.76
Dividend per share, SEK 3.0013.00
Operating cash fl ow,
Industrial Operations, SEK bn 6.4 1.5
Return on shareholders’ equity, % 2.8 5.0
Number of permanent employees 92,822 95,533
Share of women, % 18 17
Share of women,Presidents and other senior
executives, % 21 19
Employee Engagement Index, % 72 76
Energy consumption, MWh/SEK M 7.9 9.6
CO2 emissions, tons/SEK M 0.8 1.1
Water consumption, m3/SEK M 18.1 21.9
Share of direct material purchasing spend
from suppliers having made a CSR self-
assessment, % 80 72
1 According to the Board’s proposal.
Key ratios 2014 2013 Key ratios 2014 2013