Volvo 2014 Annual Report Download - page 8
Download and view the complete annual report
Please find page 8 of the 2014 Volvo annual report below. You can navigate through the pages in the report by either clicking on the pages listed below, or by using the keyword search tool below to find specific information within the annual report.-
 1
1 -
 2
2 -
 3
3 -
 4
4 -
 5
5 -
 6
6 -
 7
7 -
 8
8 -
 9
9 -
 10
10 -
 11
11 -
 12
12 -
 13
13 -
 14
14 -
 15
15 -
 16
16 -
 17
17 -
 18
18 -
 19
19 -
20
-
21
-
22
-
23
-
24
-
25
-
26
-
27
-
28
-
29
-
30
-
31
-
32
-
33
-
34
-
35
-
36
-
37
-
38
-
39
-
40
-
41
-
42
-
43
-
44
-
45
-
46
-
47
-
48
-
49
-
50
-
51
-
52
-
53
-
54
-
55
-
56
-
57
-
58
-
59
-
60
-
61
-
62
-
63
-
64
-
65
-
66
-
67
-
68
-
69
-
70
-
71
-
72
-
73
-
74
-
75
-
76
-
77
-
78
-
79
-
80
-
81
-
82
-
83
-
84
-
85
-
86
-
87
-
88
-
89
-
90
-
91
-
92
-
93
-
94
-
95
-
96
-
97
-
98
-
99
-
100
-
101
-
102
-
103
-
104
-
105
-
106
-
107
-
108
-
109
-
110
-
111
-
112
-
113
-
114
-
115
-
116
-
117
-
118
-
119
-
120
-
121
-
122
-
123
-
124
-
125
-
126
-
127
-
128
-
129
-
130
-
131
-
132
-
133
-
134
-
135
-
136
-
137
-
138
-
139
-
140
-
141
-
142
-
143
-
144
-
145
-
146
-
147
-
148
-
149
-
150
-
151
-
152
-
153
-
154
-
155
-
156
-
157
-
158
-
159
-
160
-
161
-
162
-
163
-
164
-
165
-
166
-
167
-
168
-
169
-
170
-
171
-
172
-
173
-
174
-
175
-
176
-
177
-
178
-
179
-
180
-
181
-
182
-
183
-
184
-
185
-
186
-
187
-
188
-
189
-
190
-
191
-
192
-
193
-
194
 |
 |

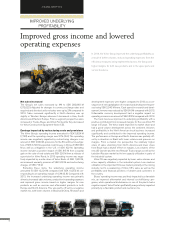
In 2014, the Volvo Group improved the underlying profi tability as
a result of better volumes, reduced operating expenses from the
effi ciency measures being implemented across the Group and
higher margins for both new products and in the spare parts and
service business.
Improved gross income and lowered
operating expenses
A GLOBAL GROUP 2014
IMPROVED UNDERLYING
PROFITABILITY
Net sales increased
The Group’s net sales increased by 4% to SEK 282,948 M
(272,622). Adjusted for changes in currency exchange rates and
acquired and divested units net sales were up by 2% compared to
2013. Sales increased signifi cantly in North America, was up
slightly in Western Europe whereas it decreased in Asia, South
America and Eastern Europe. From a segment perspective sales
increased in Trucks, Buses and Volvo Penta while they decreased
for Volvo Construction Equipment (Volvo CE).
Earnings impacted by restructuring costs and provisions
The Volvo Group’s operating income amounted to SEK 5,824 M
(7,138) and the operating margin was 2.1% (2.6). The operating
income was negatively impacted by restructuring charges in an
amount of SEK 2,569 M, provisions for the EU antitrust investiga-
tion of SEK 3,790 M, expected credit losses in China of SEK 660
M as well as a litigation in the U.S. of SEK 422 M. Operating
income includes a positive impact of SEK 815 M from a capital
gain on the sale of real estate and SEK 226 M from a release of
a provision for Volvo Rents. In 2013 operating income was nega-
tively impacted by a write-down of Volvo Rents of SEK 1,500 M,
an increased warranty provision of SEK 900 M and restructuring
charges of SEK 715 M.
Excluding these items, the underlying operating income
amounted to SEK 12,224 M compared with SEK 10,253 M, cor-
responding to an operating margin of 4.3% (3.8). Compared with
2013, the increased underlying operating income was primarily
driven by increased sales volumes, a reduction in operating expenses
and improved gross income based on higher margins for new
products as well as services and aftermarket products in both
Europe and North America. This was partly off-set by a negative
market mix, with lower volumes in Brazil and China. Research and
development expenses were higher compared to 2013 as a con-
sequence of net capitalization of research and development ex pen-
ses being SEK 2,340 M lower. Cash spend in research and devel-
opment, however was reduced by SEK 916 M compared with 2013.
Unfavorable currency development had a negative impact on
operating income in an amount of SEK 422 M compared with 2013.
The truck business improved its underlying profi tability with a
positive contribution from increased margins for the new Volvo FH
range in Europe. The Volvo brand improved its market share and
had a good volume development across the continent. Volumes
and profi tability in the North American truck business increased
signifi cantly and contributed to the improved operating income.
The performance in Europe and North America was partially off-
set by a downturn in Brazil with lower volumes and pressure on
margins. From a market mix perspective the relatively higher
share of sales stemming from North America and lower share
from Brazil had a dilutive effect on margins. Low volumes of the
new UD Quester and the new Renault Trucks range as well as the
turbulent Russian market led to low capacity utilization in parts of
the industrial system.
Volvo CE was negatively impacted by lower sales volumes and
a low capacity utilization in the industrial system. Low machine
utilization in the important Chinese market, primarily in the mining
industry, led to a weakening of Volvo CE’s sales as well as the
profi tability and fi nancial positions of dealers and customers in
the country.
Buses’ operating income was positively impacted by a favorable
mix, an improved aftermarket and internal cost-effi ciency pro-
grams, while operational disturbances in one of the plants had a
negative impact. Volvo Penta’s profi tability was positively impacted
primarily by a favorable product and customer mix.
4