Volvo 2014 Annual Report Download - page 119
Download and view the complete annual report
Please find page 119 of the 2014 Volvo annual report below. You can navigate through the pages in the report by either clicking on the pages listed below, or by using the keyword search tool below to find specific information within the annual report.-
 1
1 -
2
-
3
-
4
-
5
-
6
-
7
-
8
-
9
-
10
-
11
-
12
-
13
-
14
-
15
-
16
-
17
-
18
-
19
-
20
-
21
-
22
-
23
-
24
-
25
-
26
-
27
-
28
-
29
-
30
-
31
-
32
-
33
-
34
-
35
-
36
-
37
-
38
-
39
-
40
-
41
-
42
-
43
-
44
-
45
-
46
-
47
-
48
-
49
-
50
-
51
-
52
-
53
-
54
-
55
-
56
-
57
-
58
-
59
-
60
-
61
-
62
-
63
-
64
-
65
-
66
-
67
-
68
-
69
-
70
-
71
-
72
-
73
-
74
-
75
-
76
-
77
-
78
-
79
-
80
-
81
-
82
-
83
-
84
-
85
-
86
-
87
-
88
-
89
-
90
-
91
-
92
-
93
-
94
-
95
-
96
-
97
-
98
-
99
-
100
-
101
-
102
-
103
-
104
-
105
-
106
-
107
-
108
-
 109
109 -
 110
110 -
 111
111 -
 112
112 -
 113
113 -
 114
114 -
 115
115 -
 116
116 -
 117
117 -
 118
118 -
 119
119 -
 120
120 -
 121
121 -
 122
122 -
 123
123 -
 124
124 -
 125
125 -
 126
126 -
 127
127 -
 128
128 -
 129
129 -
130
-
131
-
132
-
133
-
134
-
135
-
136
-
137
-
138
-
139
-
140
-
141
-
142
-
143
-
144
-
145
-
146
-
147
-
148
-
149
-
150
-
151
-
152
-
153
-
154
-
155
-
156
-
157
-
158
-
159
-
160
-
161
-
162
-
163
-
164
-
165
-
166
-
167
-
168
-
169
-
170
-
171
-
172
-
173
-
174
-
175
-
176
-
177
-
178
-
179
-
180
-
181
-
182
-
183
-
184
-
185
-
186
-
187
-
188
-
189
-
190
-
191
-
192
-
193
-
194
 |
 |

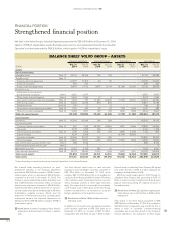
Net fi nancial position, SEK M Industrial Operations Volvo Group
Dec 31
2014 Dec 31
2013
Dec 31
2014 Dec 31
2013
Non-current interest-bearing assets
Non-current customer-fi nancing
receivables – – 51,331 43,792
Non-current interest-bearing receivables 1,041 550 1,441 480
Current interest-bearing assets
Customer-fi nancing receivables – – 47,836 40,069
Interest-bearing receivables 1,736 1,645 1,113 909
Internal funding 4,374 2,256 – –
Interest-bearing assets held for sale – 2 – 2
Marketable securities 6,927 2,570 7,312 2,591
Cash and bank 24,178 25,660 26,242 26,968
Total fi nancial assets 38,256 32,683 135,275 114,811
Non-current interest-bearing liabilities
Bond loans (68,877) (46,585) (68,877) (46,585)
Other loans (27,395) (31,219) (39,154) (36,864)
Internal funding 59,955 34,027 ––
Current interest-bearing liabilities
Loans (32,130) (46,806) (39,953) (51,552)
Internal funding 20,267 38,090 ––
Interest-bearing liabilities held for sale – (18) –(18)
Total fi nancial liabilities (48,180) (52,511) (147,984) (135,019)
Net fi nancial position excl. post-
employment benefi ts (9,924) (19,828) (12,709) (20,208)
Provision for post-employment benefi ts, net (16,454) (12,238) (16,557) (12,300)
Net fi nancial position incl.
post- employment benefi ts (26,378) (32,066) (29,266) (32,508)
Net debt, Industrial Operations, SEK bn
2013 2014
Q4
(26.4)
Q3
(37.4)
Q2
(37.8)
Q1
(34.5)
Q4
(32.1)
Q3
(42.8)
Q2
(41.5)
Q1
(42.7)
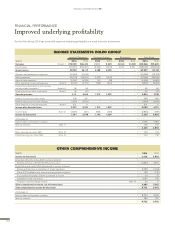
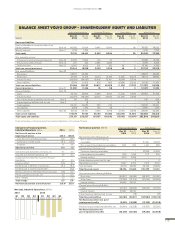
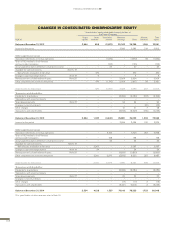
BALANCE SHEET VOLVO GROUP – SHAREHOLDERS’ EQUITY AND LIABILITIES
Industrial Operations Customer Finance Eliminations Volvo Group
SEK M
Dec 31
2014 Dec 31
2013
Dec 31
2014 Dec 31
2013
Dec 31
2014 Dec 31
2013
Dec 31
2014 Dec 31
2013
Equity and liabilities
Equity attributable to the equity holder of the
Parent Company Note 19 68,382 67,134 9,943 8,906 – (8) 78,325 76,032
Minority interests Note 11 1,723 1,333 – – – – 1,723 1,333
Total equity 70,105 68,467 9,943 8,90 6 – (8) 80,048 77,365
Non-current provisions
Provisions for post-employment benefi ts Note 20 16,580 12,249 103 73 – – 16,683 12,322
Provisions for deferred taxes Note 10 201 324 2,595 2,082 – – 2,796 2,406
Other provisions Note 21 12,463 6,005 231 183 46 2 12,740 6,190
Total non-current provisions 29,244 18,578 2,929 2,338 46 2 32,219 20,918
Non-current liabilities Note 22
Bond loans 68,877 46,585 – – – – 68,877 46,585
Other loans 27,395 31,219 13,013 12,182 (1,254) (6,537) 39,154 36,864
Internal funding1 (59,955) (34,027) 42,997 35,761 16,958 (1,734) – –
Other liabilities 17,549 14,315 607 665 (4,424) (3,503) 13,732 11,477
Total non-current liabilities 53,866 58,092 56,617 48,608 11,280 (11,774) 121,763 94,926
Current provisions Note 21 12,390 11,246 76 58 7 0 12,473 11,304
Current liabilities Note 22
Loans 32,130 46,806 9,266 6,705 (1,443) (1,959) 39,953 51,552
Internal funding1 (20,267) (38,090) 42,002 39,659 (21,735) (1,569) – –
Non interest-bearing liabilities held for sale Note 3 130 332 – – – – 130 332
Interest-bearing liabilities held for sale Note 3 – 18 – – – – – 18
Trade payables 56,351 53,685 296 216 – – 56,647 53,901
Tax liabilities 2,558 1,072 135 48 – – 2,693 1,120
Other liabilities Note 22 36,674 33,331 3,493 2,758 (3,197) (2,696) 36,970 33,393
Total current liabilities 107,576 97,154 55,192 49,386 (26,375) (6,224) 136,393 140,316
Total equity and liabilities 273,181 253,537 124,757 109,296 (15,042) (18,004) 382,896 344,829
1 Internal funding is internal lending from Industrial Operations to Customer Finance.
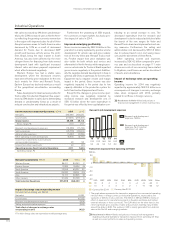
Change in net fi nancial position,
Industrial Operations, SEK bn 2014 2013
Net fi nancial position at the
beginning of period (32.1) (38.0)
Cash fl ow from operating activities 14.3 14.6
Investments in fi xed assets (9.1) (13.7)
Disposals 1.1 0.6
Operating cash fl ow 6.4 1.5
Investments and divestments of shares, net 0.1 0.0
Acquired and divested operations, net 7.7 0.4
Capital injections (to)/from Customer Finance
Operations 0.7 0.4
Currency effect (0.5) 3.4
Dividend paidto AB Volvo shareholders (6.1) (6.1)
Dividend paid to minority shareholders – (0.2)
Remeasurements of defi ned benefi t pension plans (3.6) 6.0
Pension payments and costs, net 0.7 0.3
Other changes 0.2 0.2
Total change 5.7 5.9
Net fi nancial position at end of period (26.4) (32.1)
FINANCIAL INFORMATION 2014
115