Volvo 2014 Annual Report Download - page 167
Download and view the complete annual report
Please find page 167 of the 2014 Volvo annual report below. You can navigate through the pages in the report by either clicking on the pages listed below, or by using the keyword search tool below to find specific information within the annual report.-
 1
1 -
2
-
3
-
4
-
5
-
6
-
7
-
8
-
9
-
10
-
11
-
12
-
13
-
14
-
15
-
16
-
17
-
18
-
19
-
20
-
21
-
22
-
23
-
24
-
25
-
26
-
27
-
28
-
29
-
30
-
31
-
32
-
33
-
34
-
35
-
36
-
37
-
38
-
39
-
40
-
41
-
42
-
43
-
44
-
45
-
46
-
47
-
48
-
49
-
50
-
51
-
52
-
53
-
54
-
55
-
56
-
57
-
58
-
59
-
60
-
61
-
62
-
63
-
64
-
65
-
66
-
67
-
68
-
69
-
70
-
71
-
72
-
73
-
74
-
75
-
76
-
77
-
78
-
79
-
80
-
81
-
82
-
83
-
84
-
85
-
86
-
87
-
88
-
89
-
90
-
91
-
92
-
93
-
94
-
95
-
96
-
97
-
98
-
99
-
100
-
101
-
102
-
103
-
104
-
105
-
106
-
107
-
108
-
109
-
110
-
111
-
112
-
113
-
114
-
115
-
116
-
117
-
118
-
119
-
120
-
121
-
122
-
123
-
124
-
125
-
126
-
127
-
128
-
129
-
130
-
131
-
132
-
133
-
134
-
135
-
136
-
137
-
138
-
139
-
140
-
141
-
142
-
143
-
144
-
145
-
146
-
147
-
148
-
149
-
150
-
151
-
152
-
153
-
154
-
155
-
156
-
 157
157 -
 158
158 -
 159
159 -
 160
160 -
 161
161 -
 162
162 -
 163
163 -
 164
164 -
 165
165 -
 166
166 -
 167
167 -
 168
168 -
 169
169 -
 170
170 -
 171
171 -
 172
172 -
 173
173 -
 174
174 -
 175
175 -
 176
176 -
 177
177 -
178
-
179
-
180
-
181
-
182
-
183
-
184
-
185
-
186
-
187
-
188
-
189
-
190
-
191
-
192
-
193
-
194
 |
 |
163
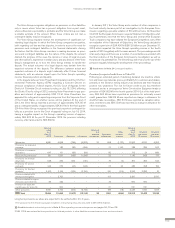
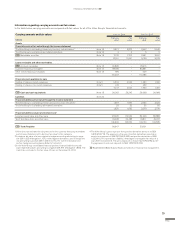
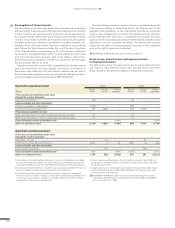
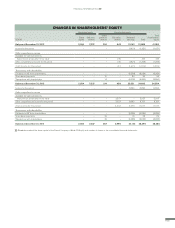
Carrying amounts and fair values Dec 31, 2014 Dec 31, 2013
SEK M Carrying
value Fair
value Carrying
value Fair
value
Assets
Financial assets at fair value through the income statement
The Volvo Group’s outstanding interest and currency risk derivatives4Note 16 2,877 2,877 2,542 2,542
The Volvo Group's outstanding raw material derivatives Note 16 3 3 5 5
B/S Marketable securities Note 18 7,312 7,312 2,591 2,591
10,191 10,191 5,138 5,138
Loans receivable and other receivables
B/S Accounts receivable Note 16 30,895 – 29,415 –
Customer fi nancing receivables1Note 15 99,166 – 83,861 –
Other interest-bearing receivables Note 16 976 – 509 –
131,037– 113,785–
Financial assets available for sale
Holding of sharesin listed companies Note 5 4,543 4,543 1,490 1,490
Holding of sharesin non-listed companies Note 5 474 – 460 –
5,017 4,543 1,950 1,490
B/S Cash and cash equivalents Note 18 26,242 26,242 26,968 26,968
Liabilities Note 22
Financial liabilities at fair value through the income statement
The Volvo Group'soutstanding interest and currency risks derivatives21,597 1,597 2,324 2,324
The Volvo Group's outstanding raw material derivatives 23 23 55 55
1,620 1,620 2,379 2,379
Financial liabilities valued at amortized cost3
Long term bond loans and other loans 107,495 112,564 83,309 86,888
Short term bank loans and other loans 39,498 39,488 49,811 49,937
146,993 152,052 133,120 136,825
B/S Trade Payables 56,647 – 53,901 –
1 Volvo does not estimate the risk premium for the customer fi nancing receivables
and chooses therefore not to disclose fair value for this category.
2 Includes a fair value of a loan related to hedge accounting amounting to nega-
tive SEK 1,022 M (negative 1,157), netted against derivatives used to hedge the
risk amounting to positive SEK 1,032 M (1,171). For further information see
section hedge accounting below. Refer to footnote 4.
3 In the Volvo Group consolidated fi nancial position, fi nancial liabilities include
loan-related derivatives amounting to negative SEK 991 M (negative 1,893). The
credit risk is included in the fair value of loans on December 31, 2014.
4 The Volvo Group’s gross exposure from positive derivatives amounts to SEK
3,909 M (3,713). The exposure is the sum of positive derivatives reported as
assets to an amount of SEK 2,877 M (2,542) and positive derivatives of SEK
1,032 M (1,171) reported as a liability, netted against a negative fair value of a
loan. Refer to footnote 2. The gross exposure is reduced by 60% (41%) bynet-
ting agreements and cash deposits to SEK 1,582 M (2,203).
Read more in Note 4 about Goals and policies in fi nancial risk management.
Information regarding carrying amounts and fair values
In the table below, carrying amounts are compared with fair values for all of the Volvo Group’s fi nancial instruments.
FINANCIAL INFORMATION 2014