Volvo 2014 Annual Report Download - page 82
Download and view the complete annual report
Please find page 82 of the 2014 Volvo annual report below. You can navigate through the pages in the report by either clicking on the pages listed below, or by using the keyword search tool below to find specific information within the annual report.-
 1
1 -
2
-
3
-
4
-
5
-
6
-
7
-
8
-
9
-
10
-
11
-
12
-
13
-
14
-
15
-
16
-
17
-
18
-
19
-
20
-
21
-
22
-
23
-
24
-
25
-
26
-
27
-
28
-
29
-
30
-
31
-
32
-
33
-
34
-
35
-
36
-
37
-
38
-
39
-
40
-
41
-
42
-
43
-
44
-
45
-
46
-
47
-
48
-
49
-
50
-
51
-
52
-
53
-
54
-
55
-
56
-
57
-
58
-
59
-
60
-
61
-
62
-
63
-
64
-
65
-
66
-
67
-
68
-
69
-
70
-
71
-
 72
72 -
 73
73 -
 74
74 -
 75
75 -
 76
76 -
 77
77 -
 78
78 -
 79
79 -
 80
80 -
 81
81 -
 82
82 -
 83
83 -
 84
84 -
 85
85 -
 86
86 -
 87
87 -
 88
88 -
 89
89 -
 90
90 -
 91
91 -
 92
92 -
93
-
94
-
95
-
96
-
97
-
98
-
99
-
100
-
101
-
102
-
103
-
104
-
105
-
106
-
107
-
108
-
109
-
110
-
111
-
112
-
113
-
114
-
115
-
116
-
117
-
118
-
119
-
120
-
121
-
122
-
123
-
124
-
125
-
126
-
127
-
128
-
129
-
130
-
131
-
132
-
133
-
134
-
135
-
136
-
137
-
138
-
139
-
140
-
141
-
142
-
143
-
144
-
145
-
146
-
147
-
148
-
149
-
150
-
151
-
152
-
153
-
154
-
155
-
156
-
157
-
158
-
159
-
160
-
161
-
162
-
163
-
164
-
165
-
166
-
167
-
168
-
169
-
170
-
171
-
172
-
173
-
174
-
175
-
176
-
177
-
178
-
179
-
180
-
181
-
182
-
183
-
184
-
185
-
186
-
187
-
188
-
189
-
190
-
191
-
192
-
193
-
194
 |
 |

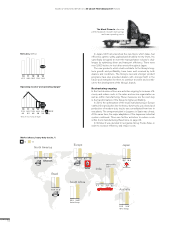
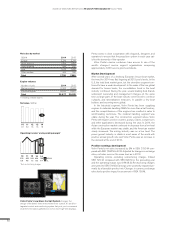
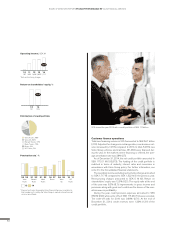
Net sales by market
SEK M 2014 2013
Europe 6,139 5,429
North America 6,721 5,929
South America 2,559 1,836
Asia 1,892 2,055
Other markets 1,334 1,457
Total 18,645 16,707
Deliveries by market
Number of buses 2014 2013
Europe 2,221 2,146
North America 1,590 1,752
South America 2,985 2,434
Asia 1,242 1,822
Other markets 721 756
Total 8,759 8,910
Net sales, SEK bn
14
16.7 18.6
13
19.6
12
21.8
11
20.5
10
18.6
Operating income (loss)* and operating margin*
SEK M
%
13
(190)
(1.1)
14
98
0.5
12
148
0.8
1,114
5.1
11
780
3.8
10
98
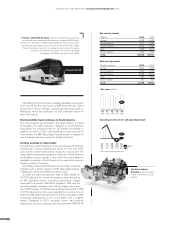
Prevost celebrated 90 years. Prevost, the leading manufacturer
of premium motor coaches and commuters, marked the 90th anni-
versary of its founding in 1924. From Eugène Prevost’s fi rst wooden-
frame bus body to today’s iconic Prevost X3-45 and H3-45 models,
Prevost has been known for its unwavering commitment to quality,
innovation, and attention to detail. The theme of the 90th
anniversary was “Moving forward since 1924”.
Prevost H3-45Pr
e
BOARD OF DIRECTORS’ REPORT 2014 GROUP PERFORMANCE BUSES
* Excl. restructuring charges
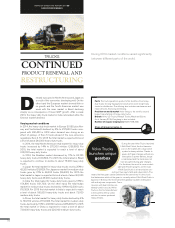
Volvo Buses’ North American subsidiary, Nova Bus, received an
order for 414 low fl oor city buses for MTA New York City Transit
during 2014. Prevost offi cially opened manufacturing facility in
Plattsburg, where the production of 300 commuter buses for
New York started.
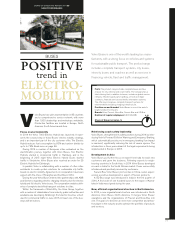
Electromobility trend continues in South America
The trend towards electromobility, with large interest in hybrid
technologies for public transport, continues in South America.
Volvo Buses has received orders for 137 hybrids to Colombia. In
addition an order of 155 conventional buses was received for
Transmilênio, the BRT (Bus Rapid Transit) system in Bogotá. A
new bus dealer has been opened in Andina, Colombia.
Positive earnings in slow market
The global bus market remained on low levels during 2014. Europe
experienced a positive development during the fi rst half of the
year, but the market slowed down during the second half. The
Asian market is slowly recovering, from low levels. In South America,
the Brazilian city bus market is slow, while the coach market is
gradually recovering. In North America, the coach and commuter
markets continue to improve.
Volvo Buses delivered 8,759 buses during 2014, compared
to 8,910 units in 2013, a decline of 2%. Order intake totaled
7,888 buses, which was 18% lower than in 2013.
In 2014 net sales increased by 12% to SEK 18,645 M
(16,707). Adjusted for currency fl uctuations, sales decreased
by 8%. Operating income excluding restructuring charges
amounted to a positive SEK 98 M (negative: 190), and the
operating margin excluding restructuring charges was a posi-
tive 0.5% (negative 1.1). Restructuring charges amounted to SEK
6 M (0). Operating income was impacted by a positive mix, an
improved aftermarket and internal cost effi ciency programs, while
operational disturbances in one of the plants had a negative
impact. Compared to 2013, operating income was positively
impacted by currency exchange rates in an amount of SEK 81 M.
The Volvo Hybrid
Driveline is world-leading
in both fuel effi ciency and
uptime.
78