Volvo 2014 Annual Report Download - page 117
Download and view the complete annual report
Please find page 117 of the 2014 Volvo annual report below. You can navigate through the pages in the report by either clicking on the pages listed below, or by using the keyword search tool below to find specific information within the annual report.-
 1
1 -
2
-
3
-
4
-
5
-
6
-
7
-
8
-
9
-
10
-
11
-
12
-
13
-
14
-
15
-
16
-
17
-
18
-
19
-
20
-
21
-
22
-
23
-
24
-
25
-
26
-
27
-
28
-
29
-
30
-
31
-
32
-
33
-
34
-
35
-
36
-
37
-
38
-
39
-
40
-
41
-
42
-
43
-
44
-
45
-
46
-
47
-
48
-
49
-
50
-
51
-
52
-
53
-
54
-
55
-
56
-
57
-
58
-
59
-
60
-
61
-
62
-
63
-
64
-
65
-
66
-
67
-
68
-
69
-
70
-
71
-
72
-
73
-
74
-
75
-
76
-
77
-
78
-
79
-
80
-
81
-
82
-
83
-
84
-
85
-
86
-
87
-
88
-
89
-
90
-
91
-
92
-
93
-
94
-
95
-
96
-
97
-
98
-
99
-
100
-
101
-
102
-
103
-
104
-
105
-
106
-
 107
107 -
 108
108 -
 109
109 -
 110
110 -
 111
111 -
 112
112 -
 113
113 -
 114
114 -
 115
115 -
 116
116 -
 117
117 -
 118
118 -
 119
119 -
 120
120 -
 121
121 -
 122
122 -
 123
123 -
 124
124 -
 125
125 -
 126
126 -
 127
127 -
128
-
129
-
130
-
131
-
132
-
133
-
134
-
135
-
136
-
137
-
138
-
139
-
140
-
141
-
142
-
143
-
144
-
145
-
146
-
147
-
148
-
149
-
150
-
151
-
152
-
153
-
154
-
155
-
156
-
157
-
158
-
159
-
160
-
161
-
162
-
163
-
164
-
165
-
166
-
167
-
168
-
169
-
170
-
171
-
172
-
173
-
174
-
175
-
176
-
177
-
178
-
179
-
180
-
181
-
182
-
183
-
184
-
185
-
186
-
187
-
188
-
189
-
190
-
191
-
192
-
193
-
194
 |
 |
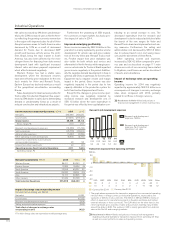
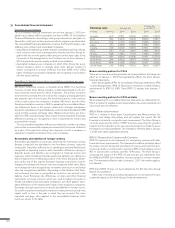
The Customer Finance operations recorded
strong levels of new business volume during the
year, driven primarily from the markets in Europe
and America. Adjusted for changes in exchange
rates, the new business volume increased by
13.5% compared to 2013. Financing pene-
tration of new Volvo Group products improved
during the year.
The gross-credit portfolio increased, on a
currency-adjusted basis by 2.4% when com-
pared to 2013. Growth was achieved net of sale
of Volvo Rents, which reduced the credit port-
folio by SEK 6.3 billion during the year. Overall
portfolio performance and credit reserves
improved with continued strong performance
noted in North America. The funding of the
credit portfolio is matched in terms of maturity,
interest rates and currencies in accordance
with Volvo Group policy.
Read more in Note 4 Goal and policies in
fi nancial risk Management in section cash fl ow
risks.
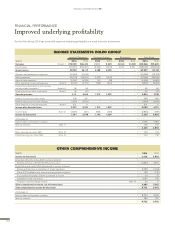
The operating income for 2014 improved to
SEK 1,717 M (1,522) excluding restructuring
charges of SEK 5 M (0). The positive impacts
are mainly due to profi table growth, improved
portfolio performance and operating expense
control.
During the year, Volvo Financial Services
syndicated approximately SEK 8.3 billion of the
credit portfolio across a number of markets,
including SEK 3.7 billion in Brazil, to support
funding and risk diversifi cation strategies,
effectively reducing concentration risk and
freeing up credit capacity to support sales.
Income Statement Customer Finance, SEK M 2014 2013
Finance and lease income 10,111 9,539
Finance and lease expenses (5,923) (5,534)
Gross income 4,188 4,005
Selling and administrative expenses (1,711) (1,640)
Credit provision expenses (858) (923)
Other operating income and expenses 98 79
Operating income 1,717 1,522
Income taxes (568) (468)
Income for the period 1,149 1,054
Return on Equity, % 12.5 12.1
Key ratios,
Customer Finance1 2014 2013
Number of fi nanced units 54,819 51,466
New fi nancing volume, SEK billion 54,7 47.0
Credit portfolio net, SEK billion 117 104
Credit provisions expenses SEK M 858 923
Operating income, excl. restructuring charges SEK M 1,717 1,522
Credit reserves, % of credit portfolio 1.33 1.31
Return on shareholders’ equity, % 12.5 12.1
Total penetration rate, % 28 27
Penetration by business area1, %
Volvo CE 39 36
Volvo Trucks 30 30
Renault Trucks 23 21
MackTrucks 23 21
Buses 27 16
UD Trucks 11 12
1 Share of unit sales fi nanced by Volvo Financial Services in relation to the total num-
ber units sold by the Volvo Group in markets where fi nancial services are offered.
Customer Finance Operations
FINANCIAL INFORMATION 2014
113