Volvo 2014 Annual Report Download - page 87
Download and view the complete annual report
Please find page 87 of the 2014 Volvo annual report below. You can navigate through the pages in the report by either clicking on the pages listed below, or by using the keyword search tool below to find specific information within the annual report.-
 1
1 -
2
-
3
-
4
-
5
-
6
-
7
-
8
-
9
-
10
-
11
-
12
-
13
-
14
-
15
-
16
-
17
-
18
-
19
-
20
-
21
-
22
-
23
-
24
-
25
-
26
-
27
-
28
-
29
-
30
-
31
-
32
-
33
-
34
-
35
-
36
-
37
-
38
-
39
-
40
-
41
-
42
-
43
-
44
-
45
-
46
-
47
-
48
-
49
-
50
-
51
-
52
-
53
-
54
-
55
-
56
-
57
-
58
-
59
-
60
-
61
-
62
-
63
-
64
-
65
-
66
-
67
-
68
-
69
-
70
-
71
-
72
-
73
-
74
-
75
-
76
-
 77
77 -
 78
78 -
 79
79 -
 80
80 -
 81
81 -
 82
82 -
 83
83 -
 84
84 -
 85
85 -
 86
86 -
 87
87 -
 88
88 -
 89
89 -
 90
90 -
 91
91 -
 92
92 -
 93
93 -
 94
94 -
 95
95 -
 96
96 -
 97
97 -
98
-
99
-
100
-
101
-
102
-
103
-
104
-
105
-
106
-
107
-
108
-
109
-
110
-
111
-
112
-
113
-
114
-
115
-
116
-
117
-
118
-
119
-
120
-
121
-
122
-
123
-
124
-
125
-
126
-
127
-
128
-
129
-
130
-
131
-
132
-
133
-
134
-
135
-
136
-
137
-
138
-
139
-
140
-
141
-
142
-
143
-
144
-
145
-
146
-
147
-
148
-
149
-
150
-
151
-
152
-
153
-
154
-
155
-
156
-
157
-
158
-
159
-
160
-
161
-
162
-
163
-
164
-
165
-
166
-
167
-
168
-
169
-
170
-
171
-
172
-
173
-
174
-
175
-
176
-
177
-
178
-
179
-
180
-
181
-
182
-
183
-
184
-
185
-
186
-
187
-
188
-
189
-
190
-
191
-
192
-
193
-
194
 |
 |

BOARD OF DIRECTORS’ REPORT 2014
GROUP PERFORMANCE
RISKS AND UNCERTAINTIES
Managed risk-taking
Risks may be due to events in the world and can
affect a given industry or market. Risks can be
specifi c to a single company. At the Volvo Group,
work is carried out daily to identify, measure and
manage risks – in some cases the Group can infl u-
ence the likelihood that a risk-related event will occur. In cases in
which such events are beyond the Group’s control, the Group
strives to minimize the consequences.
AB Volvo has, for a number of years, worked with enterprise risk
management (ERM), which is a systematic and structured pro-
cess to identify, understand, aggregate, report and mitigate the
risks that might threaten the Group’s objectives. The aim of ERM
is to improve business performance and optimize the costs of
managing risk; i.e. protecting and enhancing the Volvo Group’s
enterprise value. ERM contributes to meeting the high standards
of corporate governance expected from the Group’s stakeholders
and is looked upon as an integral part of good corporate govern-
ance as refl ected in the Swedish Corporate Governance Code.
The risks to which the Volvo Group are exposed are classifi ed
into three main categories:
• External-related risks – such as the cyclical nature of the
commercial vehicles business, intense competition, changes in
prices for commercial vehicles, political risks and government
regulations.
• Financial risks – such as currency fl uctuations, interest rate
fl uctuations, market value of shares or similar instruments, credit
risk and liquidity risk.
• Operational risks – such as market reception of new products,
reliance on suppliers, protection of intangible assets, complaints
and legal actions by customers and other third parties and risk
related to human capital.
All business operations involve risks – managed risk-taking is a
condition of maintaining a sustained favorable profi tability.
EXTERNAL-RELATED RISK
The commercial vehicles industry is cyclical
The Volvo Group’s markets undergo signifi cant changes in demand
as the general economic en vironment fl uctuates. Investments in
infrastructure, major industrial projects, mining and housing con-
struction all impact the Group’s operations as its products are
central to these sectors. Adverse changes in the economic condi-
tions for the Volvo Group’s customers may also impact ex isting
order books through cancellations of previously placed orders.
The cyclical demand for the Group’s products makes the fi nancial
result of the operations dependable on the Group’s ability to react
quickly to changes in demand, in particular to the ability to adapt
production levels and operating expenses.
Intense competition
Continued consolidation in the industry is expected to create fewer
but stronger competitors. The major competitors are Daimler, Iveco,
MAN, Navistar, Paccar, Scania, Sinotruk, Brunswick, Caterpillar,
CNH, Cummins, Deere, Hitachi, Komatsu and Terex. In recent years,
new competitors have emerged in Asia, particularly in China. These
new competitors are mainly active in their domestic markets, but are
expected to increase their presence in other parts of the world.
Prices may change
The prices of commercial vehicles have, at times, changed con-
siderably in certain markets over a short period. This instability is
caused by several factors, such as short-term variations in
demand, shortages of certain components, uncertainty regarding
underlying economic conditions, changes in import regulations,
excess inventory and increased competition. Overcapacity within
the industry can occur if there is a lack of demand, potentially
leading to increased price pressure.
Extensive government regulation
Regulations regarding exhaust emission levels, noise, safety and
levels of pollutants from production plants are extensive within
the industry.
Most of the regulatory challenges regarding products relate to
reduced engine emissions. The Volvo Group is a leading company
in the commercial vehicle industry and one of the world’s largest
producers of heavy-duty diesel engines. The product develop-
ment capacity within the Volvo Group is well consolidated to be
able to focus resources for research and development to meet
tougher emission regulations. Future product regulations are well
known, and the product development strategy is well tuned to the
introduction of new regulations.
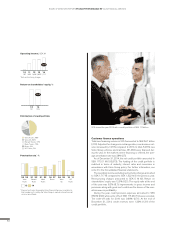
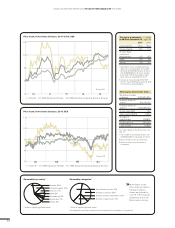
Currencies Interest rates in Sweden, Europe and the U.S.
1106 07 08 09 100504
SEK/USD
SEK/EUR
SEK/100 JPY
12 13 14
6.7 7.9 6.9 6.5 7.8 7.2 6.7 6.9 6.5 6.4 7.8
9.0 9.4 9.0 9.4 10.9 10.4 9.0 8.9 8.6 8.9 9.5
6.5 6.7 5.8 5.8 8.6 7.7 8.3 9.0 7.5 6.1 6.5
Source: Reuters
07
4.4
4.3
4.0
08
2.4
2.9
2.2
04
4.0
3.7
4.2
05
3.3
3.3
4.4
06
3.8
4.0
4.7
Source: Reuters
Government bonds, 10 year benchmarks
10
3.3
3.0
3.3
11
1.6
1.8
1.9
12
1.5
1.3
1.8
13
2.5
1.9
3.0
14
0.9
0.5
2.2
09
3.4
3.4
3.8
%
Sweden
Europe
The U.S.
83