Volvo 2014 Annual Report Download - page 151
Download and view the complete annual report
Please find page 151 of the 2014 Volvo annual report below. You can navigate through the pages in the report by either clicking on the pages listed below, or by using the keyword search tool below to find specific information within the annual report.-
 1
1 -
2
-
3
-
4
-
5
-
6
-
7
-
8
-
9
-
10
-
11
-
12
-
13
-
14
-
15
-
16
-
17
-
18
-
19
-
20
-
21
-
22
-
23
-
24
-
25
-
26
-
27
-
28
-
29
-
30
-
31
-
32
-
33
-
34
-
35
-
36
-
37
-
38
-
39
-
40
-
41
-
42
-
43
-
44
-
45
-
46
-
47
-
48
-
49
-
50
-
51
-
52
-
53
-
54
-
55
-
56
-
57
-
58
-
59
-
60
-
61
-
62
-
63
-
64
-
65
-
66
-
67
-
68
-
69
-
70
-
71
-
72
-
73
-
74
-
75
-
76
-
77
-
78
-
79
-
80
-
81
-
82
-
83
-
84
-
85
-
86
-
87
-
88
-
89
-
90
-
91
-
92
-
93
-
94
-
95
-
96
-
97
-
98
-
99
-
100
-
101
-
102
-
103
-
104
-
105
-
106
-
107
-
108
-
109
-
110
-
111
-
112
-
113
-
114
-
115
-
116
-
117
-
118
-
119
-
120
-
121
-
122
-
123
-
124
-
125
-
126
-
127
-
128
-
129
-
130
-
131
-
132
-
133
-
134
-
135
-
136
-
137
-
138
-
139
-
140
-
 141
141 -
 142
142 -
 143
143 -
 144
144 -
 145
145 -
 146
146 -
 147
147 -
 148
148 -
 149
149 -
 150
150 -
 151
151 -
 152
152 -
 153
153 -
 154
154 -
 155
155 -
 156
156 -
 157
157 -
 158
158 -
 159
159 -
 160
160 -
 161
161 -
162
-
163
-
164
-
165
-
166
-
167
-
168
-
169
-
170
-
171
-
172
-
173
-
174
-
175
-
176
-
177
-
178
-
179
-
180
-
181
-
182
-
183
-
184
-
185
-
186
-
187
-
188
-
189
-
190
-
191
-
192
-
193
-
194
 |
 |

147
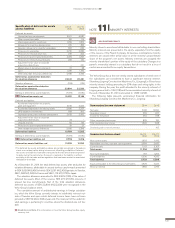
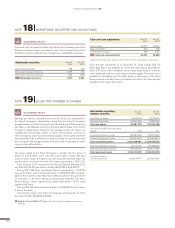
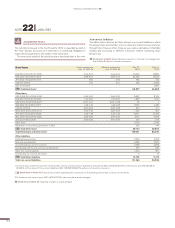
Information regarding shares 2014 2013
Number of shares, December 31, in millions 2,029 2,028
Average number of shares before dilution
in millions 2,028 2,028
Average number of shares after dilution
in millions 2,031 2,030
Average share price, SEK 89.54 93.06
Net income attributable to Parent
Company shareholders 2,099 3,583
Basic earnings per share, SEK 1.03 1.77
Diluted earnings per share, SEK 1.03 1.76
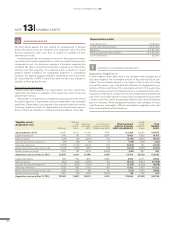
The Volvo Group’s post-employment benefi ts, such as pensions, health-
care and other benefi ts are mainly settled by means of regular payments
to independent authorities or bodies that assume pension obligations and
administer pensions through defi ned-contribution plans.
The remaining post-employment benefi ts are defi ned-benefi t plans;
that is, the obligations remain within the Volvo Group or are secured by
proprietary pension foundations. The Volvo Group’s defi ned-benefi t plans
relate mainly to subsidiaries in the U.S. and comprise both pensions and
other benefi ts, such as healthcare. Other large-scale defi ned-benefi t plans
apply to white-collar employees in Sweden (mainly through the Swedish
ITP pension plan) and employees in France and Great Britain.
SOURCES OF ESTIMATION UNCERTAINTY
!
Assumptions when calculating pensions and other
post-employment benefi ts
Provisions and costs for post-employment benefi ts, mainly pensions and
health-care benefi ts, are dependent on assumptions used by actuaries
when calculating such amounts. The appropriate assumptions and actu-
arial calculations are made separately for the respective countries of the
Volvo Group’s operations which result in obligations for post-employment
benefi ts. The assumptions include discount rates, health care cost trends
rates, infl ation, salary growth, retirement rates, mortality rates and other
factors. Health care cost trend assumptions are based on historical cost
data, the near-term outlook, and an assessment of likely long-term trends.
Infl ation assumptions are based on an evaluation of external market indi-
cators. The salary growth assumptions refl ect the historical trend, the
near-term outlook and assumed infl ation. Retirement and mortality rates
are based primarily on offi cially available mortality statistics. The actuarial
assumptions are reviewed annually by the Volvo Group and modifi ed when
deemed appropriate.
The following tables disclose information about defi ned-benefi t plans.
The Volvo Group recognizes the difference between the obligations and
the plan assets in the balance sheet. The disclosures refer to assumptions
applied for actuarial calculations, recognized costs during the fi nancial
year and the value of obligations and plan assets at year-end. The tables
also include a reconciliation of obligations and plan assets during the
year.
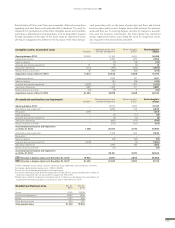
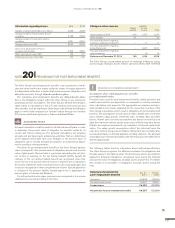
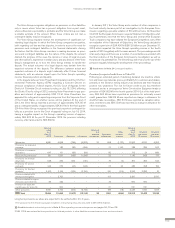
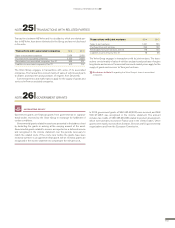
Summary of provision for
post–employment benefi ts Dec 31,
2014 Dec 31,
2013
Obligations (50,948) (39,954)
Fair value of plan assets 34,391 27,653
Funded status (16,557) (12,301)
Net provision for post-employment benefi ts (16,557) (12,301)
ACCOUNTING POLICY
Actuarial calculations shall be made for all defi ned-benefi t plans in order
to determine the present value of obligation for benefi ts vested by its
current and former employees. The actuarial calculations are prepared
annually and are based upon actuarial assumptions that are determined
at the balance-sheet date each year. Changes in the present value of
obligations due to revised actuarial assumptions and experience adjust-
ments constitute remeasurements.
Provisions for post-employment benefi ts in the Volvo Group’s balance
sheet correspond to the present value of obligations at year-end, less fair
value of plan assets. Discount rate is used when calculating the net inter-
est income or expense on the net defi ned benefi t liability (asset). All
changes in the net defi ned liability (asset) are recognized when they
occur. Service cost and net interest income or expense are recognized in
the income statement, while remeasurements such as actuarial gains and
losses are recognized in other comprehensive income. Special payroll tax
is included in the pension liability. Special payroll tax is applicable for
pension plans in Sweden and Belgium.
For defi ned contribution plans, premiums are recognized in the income
statement as incurred according to function.
NOTE 20 PROVISIONS FOR POST-EMPLOYMENT BENEFITS
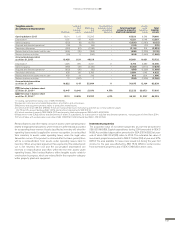
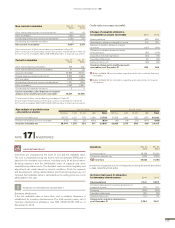
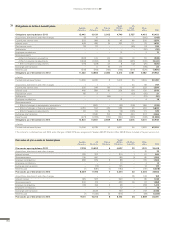
Change in other reserves Hedge
reserve
Available-
for-sale
reserve Total
Opening balance 2014 (40) 1,077 1,037
Other changes 24 – 24
Fair value adjustments regarding
holdings in Japanese companies – 11 11
Fair value adjustments regarding
Eicher Motors Ltd. – 3,037 3,037
Fair value adjustments regarding
other companies – 19 19
Balance as of December 31, 2014 (16) 4,144 4,128
The Volvo Group’s accumulated amount of exchange difference recog-
nized in equity relating to assets held for sale amounted to SEK 10 M (13).
FINANCIAL INFORMATION 2014