Volvo 2014 Annual Report Download - page 118
Download and view the complete annual report
Please find page 118 of the 2014 Volvo annual report below. You can navigate through the pages in the report by either clicking on the pages listed below, or by using the keyword search tool below to find specific information within the annual report.-
 1
1 -
2
-
3
-
4
-
5
-
6
-
7
-
8
-
9
-
10
-
11
-
12
-
13
-
14
-
15
-
16
-
17
-
18
-
19
-
20
-
21
-
22
-
23
-
24
-
25
-
26
-
27
-
28
-
29
-
30
-
31
-
32
-
33
-
34
-
35
-
36
-
37
-
38
-
39
-
40
-
41
-
42
-
43
-
44
-
45
-
46
-
47
-
48
-
49
-
50
-
51
-
52
-
53
-
54
-
55
-
56
-
57
-
58
-
59
-
60
-
61
-
62
-
63
-
64
-
65
-
66
-
67
-
68
-
69
-
70
-
71
-
72
-
73
-
74
-
75
-
76
-
77
-
78
-
79
-
80
-
81
-
82
-
83
-
84
-
85
-
86
-
87
-
88
-
89
-
90
-
91
-
92
-
93
-
94
-
95
-
96
-
97
-
98
-
99
-
100
-
101
-
102
-
103
-
104
-
105
-
106
-
107
-
 108
108 -
 109
109 -
 110
110 -
 111
111 -
 112
112 -
 113
113 -
 114
114 -
 115
115 -
 116
116 -
 117
117 -
 118
118 -
 119
119 -
 120
120 -
 121
121 -
 122
122 -
 123
123 -
 124
124 -
 125
125 -
 126
126 -
 127
127 -
 128
128 -
129
-
130
-
131
-
132
-
133
-
134
-
135
-
136
-
137
-
138
-
139
-
140
-
141
-
142
-
143
-
144
-
145
-
146
-
147
-
148
-
149
-
150
-
151
-
152
-
153
-
154
-
155
-
156
-
157
-
158
-
159
-
160
-
161
-
162
-
163
-
164
-
165
-
166
-
167
-
168
-
169
-
170
-
171
-
172
-
173
-
174
-
175
-
176
-
177
-
178
-
179
-
180
-
181
-
182
-
183
-
184
-
185
-
186
-
187
-
188
-
189
-
190
-
191
-
192
-
193
-
194
 |
 |

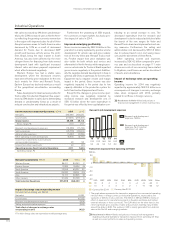
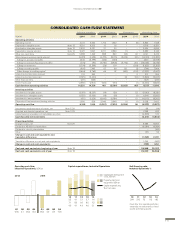
Net fi nancial debt, excluding provisions for post-
employment benefi ts, in the Industrial Operations
amounted to SEK 9.9 billion, equal to 14.2% of share-
holders equity, which is a decrease of SEK 9.9 billion
compared to the end of December 31, 2013. The
change is mainly explained by positive operating cash
fl ow of SEK 6.4 billion, the positive effect on fi nancial
debt from the divestment of assets of SEK 6.9 billion
related to Volvo Rents and the divestment of commer-
cial real estate offset by the dividend paid to AB Volvo
shareholders, negative currency effects and the
acquisition of Terex hauler business. Including post-
employment benefi ts the Industrial Operations net
debt amounted to SEK 26.4 billion, equal to 37.6% of
shareholders’ equity.
Read more in note 3 regarding Volvo Group’s
acquisitions and divestments of shares in subsidi-
aries.
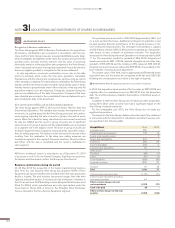
Net debt in the Volvo Group’s Industrial Operations amounted to SEK 26.4 billion at December 31, 2014,
equal to 37.6% of shareholders’ equity. Excluding provisions for post-employment benefi ts the Industrial
Operation’s net debt amounted to SEK 9.9 billion, which equal to 14.2% of shareholders’ equity.
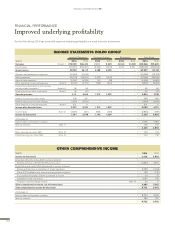
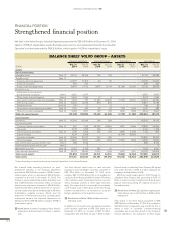
FINANCIAL POSITION
Strengthened fi nancial position
BALANCE SHEET VOLVO GROUP – ASSETS
Industrial Operations Customer Finance Eliminations Volvo Group
SEK M
Dec 31
2014 Dec 31
2013
Dec 31
2014 Dec 31
2013
Dec 31
2014 Dec 31
2013
Dec 31
2014 Dec 31
2013
Assets
Non-current assets
Intangible assets Note 12 37,010 36,479 105 109 – – 37,115 36,588
Tangible assets Note 13
Property, plant and equipment 54,821 51,819 94 87 – – 54,915 51,906
Investment property 266 327 – – – – 266 327
Assets under operating leases 19,484 17,013 17,872 13,714 (6,138) (5,055) 31,218 25,672
Financial assets
Investments in joint ventures
and associated companies Note 5 4,821 4,377 – – – – 4,821 4,377
Other shares and participations Note 5 5,004 1,944 13 6 – – 5,017 1,950
Non-current customer-fi nancing receivables Note 15 1,205 727 51,380 49,466 (1,254) (6,401) 51,331 43,792
Deferred tax assets Note 10 15,022 12,326 809 840 – – 15,831 13,166
Prepaid pensions Note 20 126 11 – 11 – – 126 22
Non-current interest-bearing receivables Note 16 1,041 550 22 34 378 (104) 1,441 480
Other non-current receivables Note 16 3,528 3,017 150 128 (165) (208) 3,513 2,937
Total non-current assets 142,328 128,590 70,445 64,395 (7,179) (11,768) 205,594 181,217
Current assets
Inventories Note 17 45,364 40,964 169 189 – – 45,533 41,153
Current receivables
Customer-fi nancing receivables Note 15 623 679 48,063 40,854 (850) (1,464) 47,836 40,069
Tax assets 2,918 1,692 496 57 – – 3,414 1,749
Interest-bearing receivables Note 16 1,736 1,645 345 473 (968) (1,209) 1,113 909
Internal funding14,3742,256––(4,374)(2,256)––
Accounts receivable Note 16 30,495 29,170 400 245 – – 30,895 29,415
Other receivables Note 16 13,950 12,207 1,984 1,383 (1,265) (936) 14,669 12,654
Non interest-bearing assets held for sale Note 3 288 8,102 – – – – 288 8,102
Interest-bearing assets held for sale Note 3 – 2 – – – – – 2
Marketable securities Note 18 6,927 2,570 385 21 – – 7,312 2,591
Cash and cash equivalents Note 18 24,178 25,660 2,470 1,679 (406) (371) 26,242 26,968
Total current assets 130,853 124,947 54,312 44,901 (7,863) (6,236) 177,302 163,612
Total assets 273 ,181 253,537 124,757 109,296 (15,042) (18,004) 382,896 344,829
1 Internal funding is internal lending from Industrial Operations to Customer Finance.
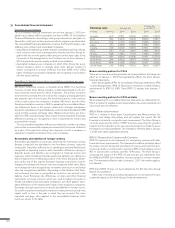
The Volvo Group’s liquid funds, i.e. cash and cash
equivalents and marketable securities, amounted to
SEK 33.6 billion on December 31, 2014 which
includes SEK 0.2 (0.2) billion that is not available for
use by the Volvo Group and SEK 6.1 billion (7.7) where
other limitations exist, mainly liquid funds in countries
where exchange controls or other legal restrictions
apply. This means that it is not possible to immediately
use the liquid funds in other parts of the Volvo Group,
however normally there is no limitation for use by the
Group’s operations in the respective country.
Read more in Note 18 Marketable securities
and liquid funds.
In addition to the liquid funds, granted but unutilized
credit facilities amounted to SEK 39.2 billion as of
December 31, 2014, an increase of SEK 7.3 billion
compared to year-end 2013. On July 1, 2014 the Volvo
Group through its subsidiary Volvo Treasury AB signed
new credit facilities of EUR 3.5 billion replacing the
company’s existing facilities in EUR.
AB Volvo issued a hybrid bond in 2014 through its
subsidiary Volvo Treasury AB, amounting to EUR 1.5
billion in order to further strengthen the Volvo Group’s
balance sheet and prolong the maturity structure of
the debt portfolio.
Read more in Note 22 Liabilities regarding the
Volvo Group’s new credit facilities in EUR and the
hybrid bond.
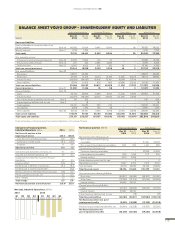
Total assets in the Volvo Group amounted to SEK
382.9 billion as of December 31, 2014, an increase of
SEK 38.1 billion compared to year-end 2013. This is
mainly a result of increased customer-fi nancing
receivables due to portfolio growth in the Customer
Finance Operations, the acquisition of Terex hauler
114
FINANCIAL INFORMATION 2014