Volvo 2014 Annual Report Download - page 4
Download and view the complete annual report
Please find page 4 of the 2014 Volvo annual report below. You can navigate through the pages in the report by either clicking on the pages listed below, or by using the keyword search tool below to find specific information within the annual report.-
 1
1 -
 2
2 -
 3
3 -
 4
4 -
 5
5 -
 6
6 -
 7
7 -
 8
8 -
 9
9 -
 10
10 -
 11
11 -
 12
12 -
 13
13 -
 14
14 -
 15
15 -
16
-
17
-
18
-
19
-
20
-
21
-
22
-
23
-
24
-
25
-
26
-
27
-
28
-
29
-
30
-
31
-
32
-
33
-
34
-
35
-
36
-
37
-
38
-
39
-
40
-
41
-
42
-
43
-
44
-
45
-
46
-
47
-
48
-
49
-
50
-
51
-
52
-
53
-
54
-
55
-
56
-
57
-
58
-
59
-
60
-
61
-
62
-
63
-
64
-
65
-
66
-
67
-
68
-
69
-
70
-
71
-
72
-
73
-
74
-
75
-
76
-
77
-
78
-
79
-
80
-
81
-
82
-
83
-
84
-
85
-
86
-
87
-
88
-
89
-
90
-
91
-
92
-
93
-
94
-
95
-
96
-
97
-
98
-
99
-
100
-
101
-
102
-
103
-
104
-
105
-
106
-
107
-
108
-
109
-
110
-
111
-
112
-
113
-
114
-
115
-
116
-
117
-
118
-
119
-
120
-
121
-
122
-
123
-
124
-
125
-
126
-
127
-
128
-
129
-
130
-
131
-
132
-
133
-
134
-
135
-
136
-
137
-
138
-
139
-
140
-
141
-
142
-
143
-
144
-
145
-
146
-
147
-
148
-
149
-
150
-
151
-
152
-
153
-
154
-
155
-
156
-
157
-
158
-
159
-
160
-
161
-
162
-
163
-
164
-
165
-
166
-
167
-
168
-
169
-
170
-
171
-
172
-
173
-
174
-
175
-
176
-
177
-
178
-
179
-
180
-
181
-
182
-
183
-
184
-
185
-
186
-
187
-
188
-
189
-
190
-
191
-
192
-
193
-
194
 |
 |
Environmental performance of Volvo production plants, Industrial operations
Absolute values related to net sales 2014 2013 201212011
Energy consumption (GWh; MWh/SEK M) 2,176; 7.9 2,536; 9.6 2,518; 8.6 2,471; 8.1
CO2 emissions (1,000 tons; tons/SEK M) 231; 0.8 280; 1.1 235; 0.8 255; 0.8
Water consumption (1,000 m3; m3/SEK M) 4,982; 18.1 5,815; 21.9 7,372; 25.2 7,970; 26.2
NOx emissions (tons; kilos/SEK M) 332; 1.2 347; 1.3 413; 1.4 474; 1.6
Solvent emissions (tons; kilos/SEK M) 2,387; 8.6 2,221; 8.4 2,358; 8.1 2,554; 8.4
Sulphur dioxide emissions (tons; kilos/SEK M) 18.3; 0.1 23.4; 0.1 26; 0.1 34; 0.1
Hazardous waste (tons; kg/SEK M) 24,944; 90.4 28,395; 107.0 32,547; 111.4 25,943; 85.5
Net sales, SEK bn 276.0 265.4 292.2 303.6
1 Restated according to new accounting rules.
2 Excluding UD Trucks and Ingersoll Rand Road Development.
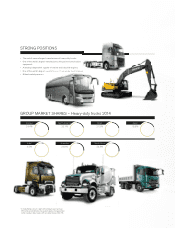
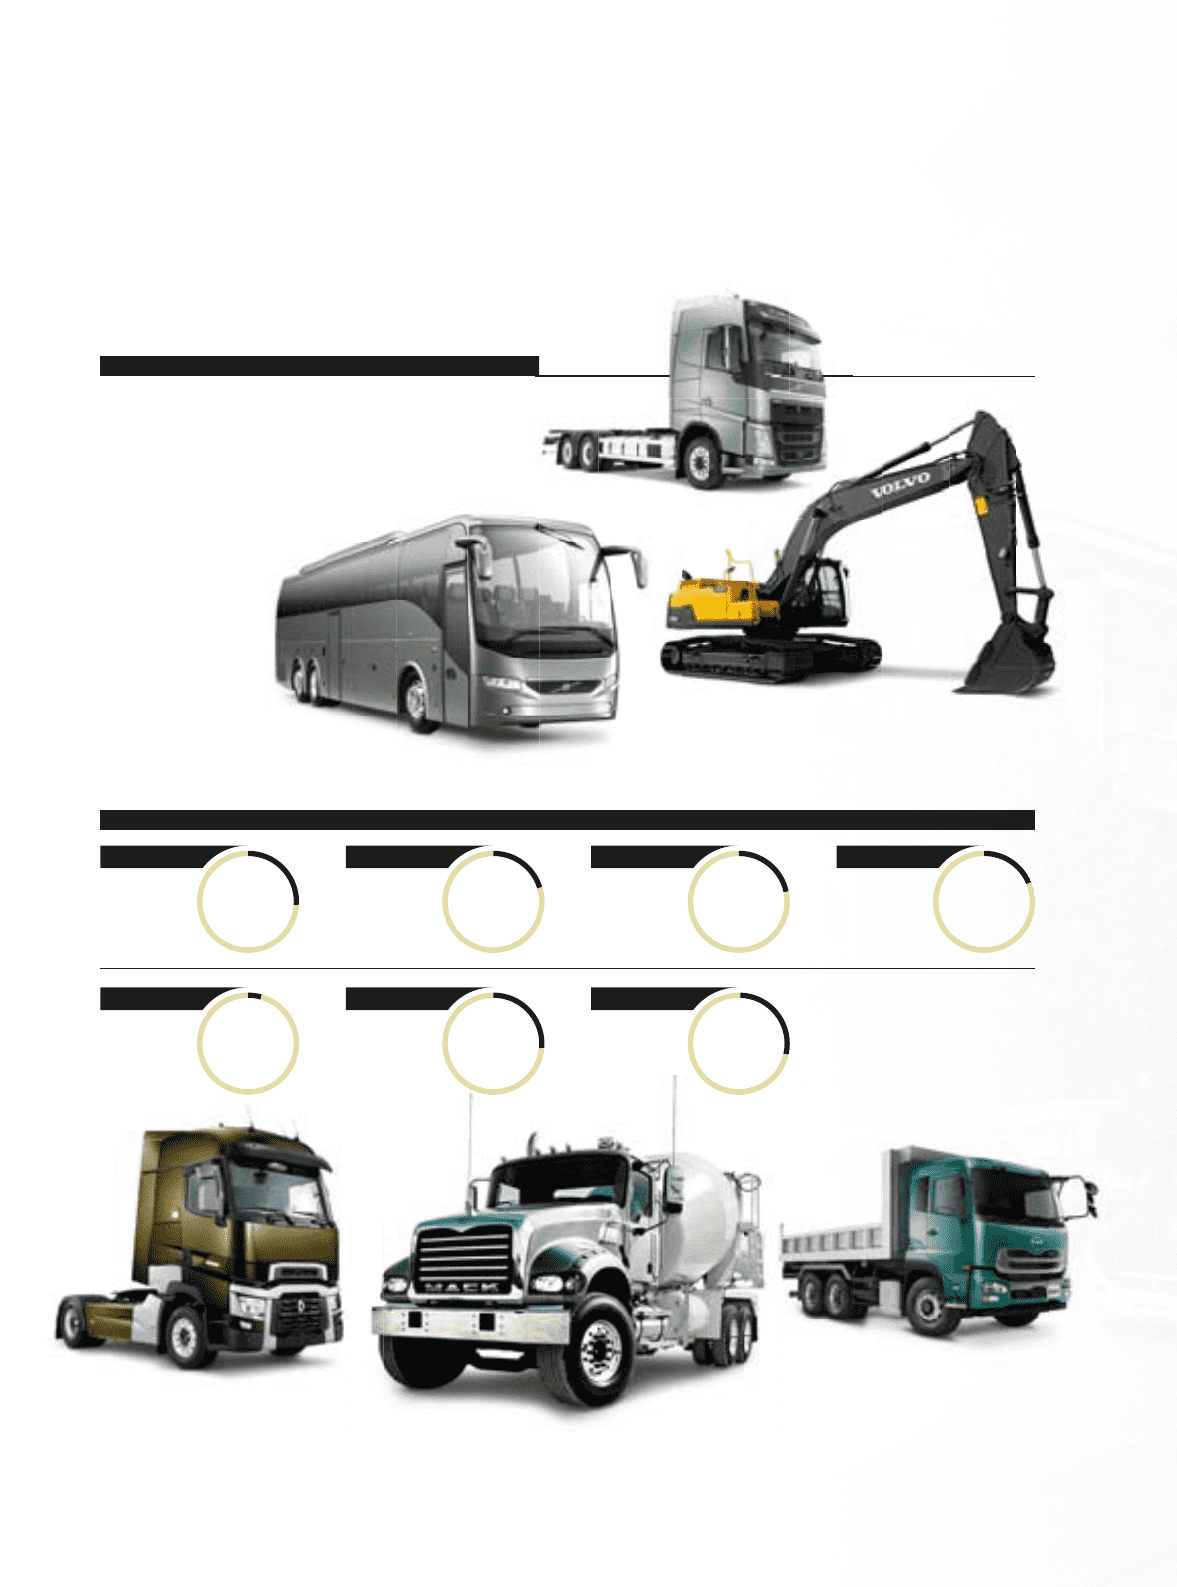
STRONG POSITIONS
• The world’s second largest manufacturer of heavy-duty trucks.
• One of the world’s largest manufacturers of buses and construction
equipment.
• A leading independent supplier of marine and industrial engines.
• One of the world’s largest manufacturers of heavy-duty diesel engines.
• Global market presence.
* In India Eicher, which is part of the Group’s joint venture
VE Commercial Vehicles, has a particularly strong position
within medium-duty trucks with a market share of 30.7%.
GROUP MARKET SHARES – Heavy-duty trucks 2014
e
st
man
an
ufa
uf
ctu
u
rer
e
s o
o
f h
h
eav
ea
y-d
y-d
uty
u
di
di
ese
e
l e
e
ngi
ng
nes
ne
e.
e
24.4%
Europe
4.3%
India*
20.1%
North America
24.6%
Australia
21.3%
Brazil
26.8%
South Africa
18.8%
Japan
s
.
.