Volvo 2014 Annual Report Download - page 131
Download and view the complete annual report
Please find page 131 of the 2014 Volvo annual report below. You can navigate through the pages in the report by either clicking on the pages listed below, or by using the keyword search tool below to find specific information within the annual report.-
 1
1 -
2
-
3
-
4
-
5
-
6
-
7
-
8
-
9
-
10
-
11
-
12
-
13
-
14
-
15
-
16
-
17
-
18
-
19
-
20
-
21
-
22
-
23
-
24
-
25
-
26
-
27
-
28
-
29
-
30
-
31
-
32
-
33
-
34
-
35
-
36
-
37
-
38
-
39
-
40
-
41
-
42
-
43
-
44
-
45
-
46
-
47
-
48
-
49
-
50
-
51
-
52
-
53
-
54
-
55
-
56
-
57
-
58
-
59
-
60
-
61
-
62
-
63
-
64
-
65
-
66
-
67
-
68
-
69
-
70
-
71
-
72
-
73
-
74
-
75
-
76
-
77
-
78
-
79
-
80
-
81
-
82
-
83
-
84
-
85
-
86
-
87
-
88
-
89
-
90
-
91
-
92
-
93
-
94
-
95
-
96
-
97
-
98
-
99
-
100
-
101
-
102
-
103
-
104
-
105
-
106
-
107
-
108
-
109
-
110
-
111
-
112
-
113
-
114
-
115
-
116
-
117
-
118
-
119
-
120
-
 121
121 -
 122
122 -
 123
123 -
 124
124 -
 125
125 -
 126
126 -
 127
127 -
 128
128 -
 129
129 -
 130
130 -
 131
131 -
 132
132 -
 133
133 -
 134
134 -
 135
135 -
 136
136 -
 137
137 -
 138
138 -
 139
139 -
 140
140 -
 141
141 -
142
-
143
-
144
-
145
-
146
-
147
-
148
-
149
-
150
-
151
-
152
-
153
-
154
-
155
-
156
-
157
-
158
-
159
-
160
-
161
-
162
-
163
-
164
-
165
-
166
-
167
-
168
-
169
-
170
-
171
-
172
-
173
-
174
-
175
-
176
-
177
-
178
-
179
-
180
-
181
-
182
-
183
-
184
-
185
-
186
-
187
-
188
-
189
-
190
-
191
-
192
-
193
-
194
 |
 |

4:4
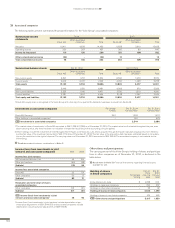
Currency impact on operating income, Industrial Operations, SEK billion 2014 2013 Change
Net flows in foreign currency (0.4)
Realizedgains and losses onhedging contracts 0.0 0.0 (0.0)
Unrealizedgains and lossesonhedging contracts (0.1) 0.0 (0.1)
Unrealizedgains and lossesonreceivables andliabilities in foreign currency (0.2) (0.3) 0.1
Translation effect on operating income in foreign subsidiaries (0.1)
Total currency impact on operating income (0.4)
Currency impact on Net flows in foreign currency is detailed in table 4:6 and Translation effect on operating income in foreign subsidiaries is
detailed in table 4:7 in key currencies.
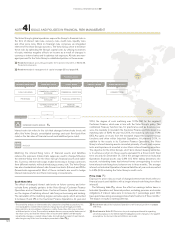
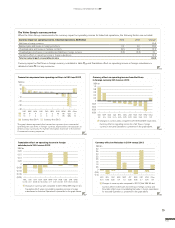
The Volvo Group’s currency review
When the Volvo Group communicates the currency impact on operating income for Industrial operations, the following factors are included:
4:8
Currency effect on Net sales in 2014 versus 2013
4.0
3.5
3.0
2.5
2.5
(0.5)
(1.0)
0.5
0
1.5
1.0
AUD
(0.1)
BRL
(0.8)
CAD
(0.2)
EUR
3.4
GBP
1.3
JPY
(0.5)
RUB
(0.8)
USD
3.7
ZAR
(0.4)
Other
0.9
Changes in currency rates compared to 2013 (Total SEK 6.5 bn).
Currency effect on Net sales from inflows in foreign currency and
translation effect when consolidating Net sales in foreign subsidiaries
for Industrial Operations is presented in the graph above.
SEK bn
4:5
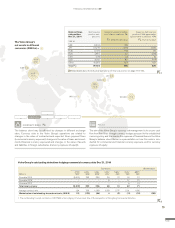
Transaction exposure from operating net flows in 2014 and 2013
4:6
Currency effect on operating income from Net flows
in foreign currency 2014 versus 2013
1.0
0.8
0.4
0.2
0.6
0
(0.2)
(0.6)
(0.8)
(0.4)
GBP
0.5
USD
0.9
NOK
(0.0)
BRL
(0.2)
ARS
(0.2)
RUB
(0.3)
ZAR
(0.2)
EUR
(0.3)
CAD
(0.1)
KRW
(0.7)
Other
0.2
Changes in currency rates compared to 2013 (Total SEK neg 0.4 bn).
Currency effect on operating income from Net flows in foreign
currency in Industrial Operations is presented in the graph above.
SEK bn
4:7
Translation effect on operating income in foreign
subsidiaries in 2014 versus 2013
0.20
0.15
0.10
0
0,05
(0.15)
(0.20)
(0.05)
(0.10)
BRL
(0.13)
CAD
0.01
CNY
(0.06)
EUR
(0.13)
GBP
(0.04)
KRW
0.17
PLN
(0.01)
RUB
(0.02)
USD
0.19
ZAR
(0.01)
Other
(0.03)
Changes in currency rates compared to 2013 (Total SEK neg 0.1 bn).
Translation effect when consolidating operating income in foreign
subsidiaries for Industrial Operations is presented in the graph above.
SEK bn
SEK bn
–40
–30
–20
–10
0
10
20
11
12
Other
(33)
(36)
SEK
(9)
(9)
KRW
(4)
1
EUR
3
2
BRL
3
3
ZAR
3
3
CAD
4
4
NOK
6
7
GBP
16
13
USD
Currency flow 2014 Currency flow 2013
The graph above represents the transaction exposure from commercial
operating net cash flows in foreign currency, expressed as net surpluses or
deficits in key currencies. For further information read more in the section
Commercial currency exposure.
127
FINANCIAL INFORMATION 2014