Volvo 2014 Annual Report Download - page 184
Download and view the complete annual report
Please find page 184 of the 2014 Volvo annual report below. You can navigate through the pages in the report by either clicking on the pages listed below, or by using the keyword search tool below to find specific information within the annual report.-
 1
1 -
2
-
3
-
4
-
5
-
6
-
7
-
8
-
9
-
10
-
11
-
12
-
13
-
14
-
15
-
16
-
17
-
18
-
19
-
20
-
21
-
22
-
23
-
24
-
25
-
26
-
27
-
28
-
29
-
30
-
31
-
32
-
33
-
34
-
35
-
36
-
37
-
38
-
39
-
40
-
41
-
42
-
43
-
44
-
45
-
46
-
47
-
48
-
49
-
50
-
51
-
52
-
53
-
54
-
55
-
56
-
57
-
58
-
59
-
60
-
61
-
62
-
63
-
64
-
65
-
66
-
67
-
68
-
69
-
70
-
71
-
72
-
73
-
74
-
75
-
76
-
77
-
78
-
79
-
80
-
81
-
82
-
83
-
84
-
85
-
86
-
87
-
88
-
89
-
90
-
91
-
92
-
93
-
94
-
95
-
96
-
97
-
98
-
99
-
100
-
101
-
102
-
103
-
104
-
105
-
106
-
107
-
108
-
109
-
110
-
111
-
112
-
113
-
114
-
115
-
116
-
117
-
118
-
119
-
120
-
121
-
122
-
123
-
124
-
125
-
126
-
127
-
128
-
129
-
130
-
131
-
132
-
133
-
134
-
135
-
136
-
137
-
138
-
139
-
140
-
141
-
142
-
143
-
144
-
145
-
146
-
147
-
148
-
149
-
150
-
151
-
152
-
153
-
154
-
155
-
156
-
157
-
158
-
159
-
160
-
161
-
162
-
163
-
164
-
165
-
166
-
167
-
168
-
169
-
170
-
171
-
172
-
173
-
 174
174 -
 175
175 -
 176
176 -
 177
177 -
 178
178 -
 179
179 -
 180
180 -
 181
181 -
 182
182 -
 183
183 -
 184
184 -
 185
185 -
 186
186 -
 187
187 -
 188
188 -
 189
189 -
 190
190 -
 191
191 -
 192
192 -
 193
193 -
 194
194
 |
 |

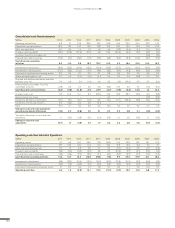
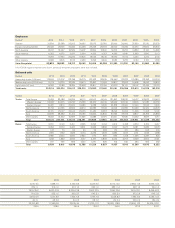
Consolidated balance sheets
SEK M 2014 2013 2012 2011 2010 2009 2008 2007 2006 2005 2004
Intangible assets 37,115 36,588 40,373 39,507 40,714 41,628 43,958 36,508 19,117 20,421 17,612
Property, plant and equipment 55,181 52,233 55,004 54,540 54,242 55,280 57,270 47,210 34,379 35,068 31,151
Assets under operating leases 31,218 25,672 29,022 23,922 19,647 20,388 25,429 22,502 20,501 20,839 19,534
Shares and participations 9,839 6,327 2,890 1,874 2,098 2,044 1,953 2,219 6,890 751 2,003
Inventories 45,533 41,153 40,409 44,599 39,837 37,727 55,045 43,645 34,211 33,937 28,598
Customer-fi nancing receivables 99,166 83,861 80,989 78,699 72,688 81,977 98,489 78,847 64,742 64,466 51,193
Interest-bearing receivables 2,555 1,389 5,635 3,638 2,757 3,044 5,101 4,530 4,116 1,897 3,384
Other receivables 68,448 59,943 55,531 59,877 53,154 50,575 61,560 55,152 42,567 42,881 35,747
Non-interest-bearing assets
held for sale 288 8,104 – 9,348 136 1,692 – – 805 – –
Cash and cash equivalents 33,554 29,559 28,889 37,241 32,733 37,910 23,614 31,034 31,099 36,947 34,746
Assets 382,896 344,829 338,742 353,244 318,007 332,265 372,419 321,647 258,427 257,207 223,968
Shareholders’ equity180,048 77,365 86,914 85,681 74,121 67,034 84,640 82,781 87,188 78,760 70,155
Provision for post-employment
benefi ts 16,683 12,322 6,697 6,665 7,510 8,051 11,705 9,774 8,692 11,986 14,703
Other provisions 28,010 19,900 21,787 20,815 18,992 19,485 29,076 27,084 20,970 18,556 14,993
Interest-bearing liabilities 147,985 135,001 131,842 130,479 123,695 156,852 145,727 108,318 66,957 74,885 61,807
Liabilities associated with assets
held for sale 130 350 – 4,716 135 272 – – 280 – –
Other liabilities 110,042 99,891 91,502 104,888 93,554 80,571 101,271 93,690 74,340 73,020 62,310
Shareholders’ equity and
liabilities 382,896 344,829 338,742 353,244 318,007 332,265 372,419 321,647 258,427 257,207 223,968
1of which minority interests 1,723 1,333 1,266 1,100 1,011 629 630 579 284 260 229
Assets pledged 7,680 5,078 4,099 1,832 3,339 958 1,380 1,556 1,960 3,255 3,046
Contingent liabilities 15,940 17,290 17,763 17,154 11,003 9,607 9,427 8,153 7,726 7,850 9,189
FINANCIAL INFORMATION 2014
180