Volvo 2014 Annual Report Download - page 136
Download and view the complete annual report
Please find page 136 of the 2014 Volvo annual report below. You can navigate through the pages in the report by either clicking on the pages listed below, or by using the keyword search tool below to find specific information within the annual report.-
 1
1 -
2
-
3
-
4
-
5
-
6
-
7
-
8
-
9
-
10
-
11
-
12
-
13
-
14
-
15
-
16
-
17
-
18
-
19
-
20
-
21
-
22
-
23
-
24
-
25
-
26
-
27
-
28
-
29
-
30
-
31
-
32
-
33
-
34
-
35
-
36
-
37
-
38
-
39
-
40
-
41
-
42
-
43
-
44
-
45
-
46
-
47
-
48
-
49
-
50
-
51
-
52
-
53
-
54
-
55
-
56
-
57
-
58
-
59
-
60
-
61
-
62
-
63
-
64
-
65
-
66
-
67
-
68
-
69
-
70
-
71
-
72
-
73
-
74
-
75
-
76
-
77
-
78
-
79
-
80
-
81
-
82
-
83
-
84
-
85
-
86
-
87
-
88
-
89
-
90
-
91
-
92
-
93
-
94
-
95
-
96
-
97
-
98
-
99
-
100
-
101
-
102
-
103
-
104
-
105
-
106
-
107
-
108
-
109
-
110
-
111
-
112
-
113
-
114
-
115
-
116
-
117
-
118
-
119
-
120
-
121
-
122
-
123
-
124
-
125
-
 126
126 -
 127
127 -
 128
128 -
 129
129 -
 130
130 -
 131
131 -
 132
132 -
 133
133 -
 134
134 -
 135
135 -
 136
136 -
 137
137 -
 138
138 -
 139
139 -
 140
140 -
 141
141 -
 142
142 -
 143
143 -
 144
144 -
 145
145 -
 146
146 -
147
-
148
-
149
-
150
-
151
-
152
-
153
-
154
-
155
-
156
-
157
-
158
-
159
-
160
-
161
-
162
-
163
-
164
-
165
-
166
-
167
-
168
-
169
-
170
-
171
-
172
-
173
-
174
-
175
-
176
-
177
-
178
-
179
-
180
-
181
-
182
-
183
-
184
-
185
-
186
-
187
-
188
-
189
-
190
-
191
-
192
-
193
-
194
 |
 |

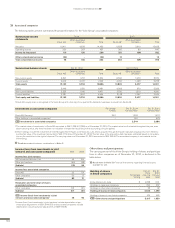
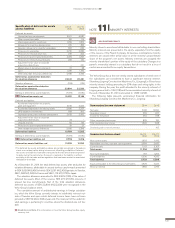
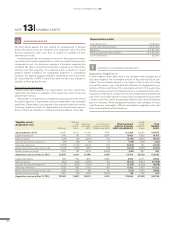
Other shares and participations
The carrying amount of the Volvo Group’s holding of shares and participa-
tions in other companies as of December 31, 2014, is disclosed in the
table below.
Read more in Note 30 Financial Instruments regarding fi nancial assets
available for sale.
Holding of shares
in listed companies Percentage
holding
Dec 31,
2014
Carrying
value
Dec 31,
2013
Carrying
value
Eicher Motors Ltd., India 8 4,228 1,191
Holdings in Japanese companies – 290 267
Holdings in other listed companies – 25 32
Holding of shares in listed companies 4,543 1,490
Holding of shares in non-listed companies 474 460
B/S Other shares and participations 5,017 1,950
Income (loss) from investments in joint
ventures and associated companies 2014 2013
Income/loss joint ventures
VE Commercial Vehicles., Ltd. 45 104
Other joint ventures (64) (48)
Subtotal (19) 56
Income/loss associated companies
Deutz AG 32 54
Other companies 50 17
Subtotal 82 71
Revaluation and write-down of shares
associated companies
Other companies (17) (31)
Subtotal (17) (31)
I/S Income (loss) from investments in joint
ventures and associated companies
146 96
1 Income (loss) from investments in joint ventures include depreciation of pur-
chase price adjustments of SEK 29 M (35) and associated companies include
depreciation of purchase price adjustments of SEK 9 M (9).
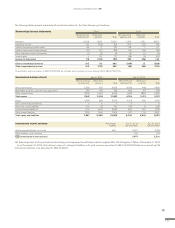
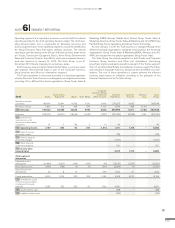
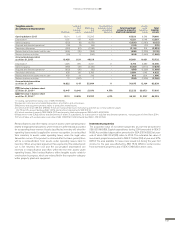
The following tables present summarized fi nancial information for the Volvo Group’s associated companies:
Summarized income
statements
2014 2013
Deutz AG1Other associated
companies Total Deutz AG1Other associated
companies Total
Net sales 10,411 4,038 14,450 11,828 3,610 15,438
Operating income 220 207 427 360 80 440
Income for the period 110 156 266 251 (69) 182
Other comprehensive income (34) – (34) 13 – 13
Total comprehensive income 76 156 232 264 (69) 195
Summarized balance sheets Dec 31, 2014 Dec 31, 2013
Deutz AG1Other associated
companies Total Deutz AG1Other associated
companies Total
Non-current assets 6,847 1,707 8,554 6,594 1,979 8,573
Current assets 5,305 2,027 7,332 4,230 1,498 5,728
Total assets 12,152 3,734 15,886 10,824 3,477 14,301
Equity 5,446 1,035 6,481 4,956 970 5,926
Non-current liabilities 3,325 1,146 4,471 3,720 1,210 4,930
Current liabilities 3,381 1,553 4,934 2,148 1,297 3,445
Total equity and liabilities 12,152 3,734 15,886 10,824 3,477 14,301
1 Deutz AG’s equity share is recognized in the Volvo Group with a time lag of one quarter. No dividends have been received from Deutz AG.
Investments in associated companies Percentage
holding Dec31, 2014
Carrying value Dec 31, 2013
Carrying value
Deutz AG, Germany
125.0 1,393 1,407
Other holdings in associated companies
2–951679
B/S Investments in associated companies 2,344 2,086
1 The market value of investments in Deutz AG amounted to SEK 1,236 M (1,756) as of December 31, 2014. The market value has fl uctuated throughout the year, even
above carrying value, why there has been no indication of impairment according to the accounting principle applied.
2 Other holdings include the investment of Inner Mongolia North Hauler Joint Stock Co., Ltd., China, acquired through the hauler manufacturing business from Terex Inc
and the fair value of the investment amounted to SEK 1,114 M as of December 31, 2014. The fair value at the acquisition date has been estimated based on considera-
tion on the restriction in the right of disposal. The carrying value as of December 31, 2014 amounted to SEK 250 M. The associated company is not material for the
Volvo Group.
Read more about business combinations in Note 3.
Associated companies
FINANCIAL INFORMATION 2014
132