Volvo 2014 Annual Report Download - page 158
Download and view the complete annual report
Please find page 158 of the 2014 Volvo annual report below. You can navigate through the pages in the report by either clicking on the pages listed below, or by using the keyword search tool below to find specific information within the annual report.-
 1
1 -
2
-
3
-
4
-
5
-
6
-
7
-
8
-
9
-
10
-
11
-
12
-
13
-
14
-
15
-
16
-
17
-
18
-
19
-
20
-
21
-
22
-
23
-
24
-
25
-
26
-
27
-
28
-
29
-
30
-
31
-
32
-
33
-
34
-
35
-
36
-
37
-
38
-
39
-
40
-
41
-
42
-
43
-
44
-
45
-
46
-
47
-
48
-
49
-
50
-
51
-
52
-
53
-
54
-
55
-
56
-
57
-
58
-
59
-
60
-
61
-
62
-
63
-
64
-
65
-
66
-
67
-
68
-
69
-
70
-
71
-
72
-
73
-
74
-
75
-
76
-
77
-
78
-
79
-
80
-
81
-
82
-
83
-
84
-
85
-
86
-
87
-
88
-
89
-
90
-
91
-
92
-
93
-
94
-
95
-
96
-
97
-
98
-
99
-
100
-
101
-
102
-
103
-
104
-
105
-
106
-
107
-
108
-
109
-
110
-
111
-
112
-
113
-
114
-
115
-
116
-
117
-
118
-
119
-
120
-
121
-
122
-
123
-
124
-
125
-
126
-
127
-
128
-
129
-
130
-
131
-
132
-
133
-
134
-
135
-
136
-
137
-
138
-
139
-
140
-
141
-
142
-
143
-
144
-
145
-
146
-
147
-
 148
148 -
 149
149 -
 150
150 -
 151
151 -
 152
152 -
 153
153 -
 154
154 -
 155
155 -
 156
156 -
 157
157 -
 158
158 -
 159
159 -
 160
160 -
 161
161 -
 162
162 -
 163
163 -
 164
164 -
 165
165 -
 166
166 -
 167
167 -
 168
168 -
169
-
170
-
171
-
172
-
173
-
174
-
175
-
176
-
177
-
178
-
179
-
180
-
181
-
182
-
183
-
184
-
185
-
186
-
187
-
188
-
189
-
190
-
191
-
192
-
193
-
194
 |
 |

154
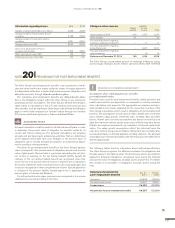
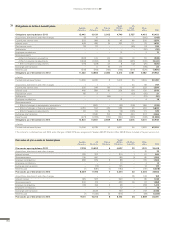
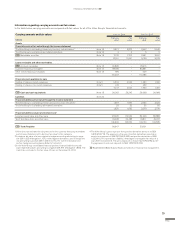
Bond loans Actual interest rate
Dec 31, 2014, % Effective interest rate
Dec 31, 2014, % Dec31,
2014 Dec 31,
2013
EUR 2007–2014/2016–2078 0.44–5.04 0.44–5.04 44,062 19,883
SEK 2007–2014/2016–2019 0.68–5.04 0.68–5.04 23,562 19,437
JPY 2013–2014/2016–2017 0.60 0.60 784 124
USD 2013/2016 0.41 0.41 469 5,246
CNY 2012/2015 – – – 1,895
B/S Total Bond loans168,877 46,585
Other loans
USD 2008–2014/2016–2024 0.46–3.00 0.46–3.00 9,852 8,105
EUR 2007–2014/2016-2027 1.44–6.50 1.45–6.50 1,869 1,734
GBP 2002–2007/2016-2027 6.00–11.11 6.00–11.68 59 1
SEK 2007–2014/2016-2017 0.42–1.61 0.42–1.62 2,055 4,180
CAD 2014/2016 2.63–2.65 2.66–2.68 874 911
MXN 2012–2014/2016–2017 4.20–4.37 4.20–4.37 1,233 847
JPY 2007–2014/2016–2023 0.45–1.38 0.45–1.39 12,701 10,772
BRL 2009–2013/2019–2024 2.86–5.90 2.93–6.00 7,517 5,932
AUD 2013–2014/2016 3.89–4.82 3.94–4.90 319 516
Other loans 2,1393,726
Revaluation of outstanding derivatives to SEK2536140
B/S Total Other loans1 39,154 36,864
Total Bond loans and Other loans3108,031 83,449
Other liabilities
Deferred leasing income 2,364 2,462
Residual value liabilities 4,586 4,840
Accrued expenses service contracts 5,498 2,928
Outstanding interest and currency risk derivatives2275256
Other non-current liabilities 1,004 981
Outstanding raw material derivatives 510
B/S Total Other liabilities 13,732 11,477
Total non-current liabilities 121,763 94,926
The hybrid bond issued in the fourth quarter 2014 is classifi ed as debt in
the Volvo Group’s accounts as it constitutes a contractual obligation to
make interest payments to the holder of the instrument.
The terms and details of the hybrid bond are described later in this note.
Non-current liabilities
The tables below disclose the Volvo Group’s non-current liabilities in which
the largest loans are listed by currency. Loans are mainly in local currencies
through Volvo Treasury. Volvo Treasury uses various derivatives to facilitate
lending and borrowing in different currencies without increasing Volvo
Group’s risk.
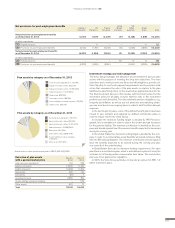
Read more in Note 4 about Goals and policies in fi nancial risk management
and in Note 30 about Financial Instruments.
NOTE 22 LIABILITIES
1 Of which loans raised to fi nance the credit portfolio of the Customer Finance Operations amounted to SEK 44,620 M (25,619) in Bond loans and SEK 28,348 M
(20,590) in Other loans. Of non-current liabilities, SEK 108,295 M (83,715) pertains to fi nancial instruments.
2 Read more in Note 30 Financial Instruments regarding Non-current part of Outstanding interest and currency risk derivatives.
3 Of the above non-current loans, SEK 4,478 M (3,181) were secured by assets pledged.
Read more in Note 23 regarding changes in assets pledged.
ACCOUNTING POLICY
FINANCIAL INFORMATION 2014