Volvo 2014 Annual Report Download - page 16
Download and view the complete annual report
Please find page 16 of the 2014 Volvo annual report below. You can navigate through the pages in the report by either clicking on the pages listed below, or by using the keyword search tool below to find specific information within the annual report.-
 1
1 -
2
-
3
-
4
-
5
-
 6
6 -
 7
7 -
 8
8 -
 9
9 -
 10
10 -
 11
11 -
 12
12 -
 13
13 -
 14
14 -
 15
15 -
 16
16 -
 17
17 -
 18
18 -
 19
19 -
 20
20 -
 21
21 -
 22
22 -
 23
23 -
 24
24 -
 25
25 -
 26
26 -
27
-
28
-
29
-
30
-
31
-
32
-
33
-
34
-
35
-
36
-
37
-
38
-
39
-
40
-
41
-
42
-
43
-
44
-
45
-
46
-
47
-
48
-
49
-
50
-
51
-
52
-
53
-
54
-
55
-
56
-
57
-
58
-
59
-
60
-
61
-
62
-
63
-
64
-
65
-
66
-
67
-
68
-
69
-
70
-
71
-
72
-
73
-
74
-
75
-
76
-
77
-
78
-
79
-
80
-
81
-
82
-
83
-
84
-
85
-
86
-
87
-
88
-
89
-
90
-
91
-
92
-
93
-
94
-
95
-
96
-
97
-
98
-
99
-
100
-
101
-
102
-
103
-
104
-
105
-
106
-
107
-
108
-
109
-
110
-
111
-
112
-
113
-
114
-
115
-
116
-
117
-
118
-
119
-
120
-
121
-
122
-
123
-
124
-
125
-
126
-
127
-
128
-
129
-
130
-
131
-
132
-
133
-
134
-
135
-
136
-
137
-
138
-
139
-
140
-
141
-
142
-
143
-
144
-
145
-
146
-
147
-
148
-
149
-
150
-
151
-
152
-
153
-
154
-
155
-
156
-
157
-
158
-
159
-
160
-
161
-
162
-
163
-
164
-
165
-
166
-
167
-
168
-
169
-
170
-
171
-
172
-
173
-
174
-
175
-
176
-
177
-
178
-
179
-
180
-
181
-
182
-
183
-
184
-
185
-
186
-
187
-
188
-
189
-
190
-
191
-
192
-
193
-
194
 |
 |

Closely linked to the GDP development
The Volvo Group is one part of the transport industry that con-
nects production with consumption. We are what you might call
the circulatory system. Demand for transport capacity and thus
for many of the Group’s products is closely linked to the GDP trend.
The extent of investment in infrastructure, which drives demand
for building and construction equipment, is also closely linked to
the GDP trend. Increasing global consumption means that there
is a long-term need to build roads, airports, railways, factories,
offi ces, shopping centers, as well as housing and recreational
facilities. The registrations of new trucks on a particular market
often follow the same pattern as economic growth in the region.
The transport industry is largely in tune with the current eco-
nomic development, but demand for the Group’s products is also
to a large extent determined by expectations about the future
business conditions.
Short-term factors affecting demand
In the short term, in addition to GDP growth, demand is affected
by a number of factors including fuel prices, interest rates, the
implementation of new emission regulations, etc. New emission
standards have traditionally resulted in more expensive, more
technically complex trucks. This has often generated an advance
purchasing effect, a pre-buy, as haulage companies have taken
the opportunity to update their fl eets just before the new regula-
tions come into force. At the same time, new regulations have
positive effects on the environment.
For instance, the EU moved to the Euro 6 emission standard at
year-end 2013. The new standard entails signifi cant cuts in emis-
sions of nitrogen oxides and particulates, which is good for the
environment. In order to reach these cuts, more advanced and thus
more expensive engine technology is needed. During the autumn
of 2013 there was an increase in demand for Euro 5 trucks as
some customers chose to invest in these trucks ahead of the new
emission standards and subsequently demand for new trucks in
Europe weakened at the beginning of 2014.
Markets move at different paces
The transportation industry is linked to economic developments,
but the global economies do not move at the same pace. Coun-
tries that are heavily dependent on exports, such as Sweden and
Germany, are more affected when consumers in other countries
tighten their belts. Countries like the USA and Brazil are also
impacted by a slowdown, but to a lesser degree, as they have such
large domestic markets and a relatively small part of what they
produce is exported.
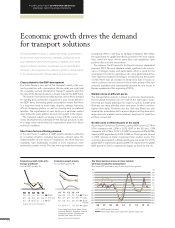
Growth rates in different parts of the world
According to Consensus Economics, global GDP grew by 2.7% in
2014 compared with 2.6% in 2013. GDP in the EU was 1.3%
compared with 0.1% in 2013. U.S. GDP increased by 2.4% (2.2%).
Japan’s GDP expanded by 0.2% (1.6%). In China, growth slowed
in 2014 whereas in India, it improved from modest levels. The
economic development in Brazil and Russia was weak. For 2015,
global GDP is expected to grow by 3.0%. The improvement in global
GDP growth in 2015 is expected to largely be driven by the US.
The transportation industry is cyclical with swings up and down in
the short term. Add new emission standards, political decisions
and expectations about future business conditions, all of which
impact customers’ decisions to purchase now or wait until later.
However, in the longer term, the industry’s growth is closely linked
to an increasing need for transportation as economies grow.
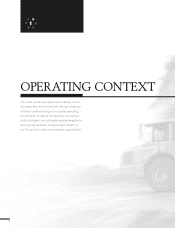
Economic growth drives the demand
for transport solutions
A GLOBAL GROUP 2014 OPERATING CONTEXT
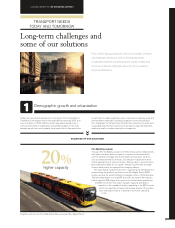
TRANSPORT NEEDS TODAY AND TOMORROW
Economic growth in the U.S.,
Europe and Brazil
Annual GDP-growth, %
Source: Consensus Economics
EU
Brazil
1.9
2.7
1.6
(0.3)
1.0
2.3
0.1
2.5
2.2
1.3
0.1
2.4 The U.S.
2.2
7.5
2.5
0
1413121110 1413121110
Economic growth in Asia
Annual GDP-growth, %
Asia/
Pacific*
India
Japan
*China, Hong Kong, South Korea, Taiwan,
Indonesia, Malaysia, Singapore, Thailand,
Phillippines, Vietnam, Australia, New
Zealand, India, Japan, Sri Lanka
Source: Consensus Economics
5.5
6.7
1.7
9.3
5.0
4.5
7.7
1.6
4.9
4.7
7.7
0.2
4.5
5.6
7.4 China
7.9
8.9
(0.4)
10.4
4.7
0
1413121110
(6)
(5)
(4)
(3)
(2)
(1)
0
1
2
3
4
5
6
%%
(60)
(50)
(40)
(30)
(20)
(10)
0
10
20
30
40
50
60
141312111009080706
GDP growth (left axis)
New heavy-duty trucks registration growth (right axis)
The Volvo business moves in close tandem
with macroeconomic development
Euro area GDP and heavy-duty trucks registration growth
12