Volvo 2014 Annual Report Download - page 68
Download and view the complete annual report
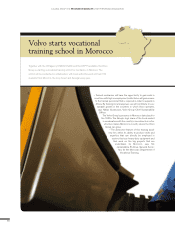
Please find page 68 of the 2014 Volvo annual report below. You can navigate through the pages in the report by either clicking on the pages listed below, or by using the keyword search tool below to find specific information within the annual report.-
 1
1 -
2
-
3
-
4
-
5
-
6
-
7
-
8
-
9
-
10
-
11
-
12
-
13
-
14
-
15
-
16
-
17
-
18
-
19
-
20
-
21
-
22
-
23
-
24
-
25
-
26
-
27
-
28
-
29
-
30
-
31
-
32
-
33
-
34
-
35
-
36
-
37
-
38
-
39
-
40
-
41
-
42
-
43
-
44
-
45
-
46
-
47
-
48
-
49
-
50
-
51
-
52
-
53
-
54
-
55
-
56
-
57
-
 58
58 -
 59
59 -
 60
60 -
 61
61 -
 62
62 -
 63
63 -
 64
64 -
 65
65 -
 66
66 -
 67
67 -
 68
68 -
 69
69 -
 70
70 -
 71
71 -
 72
72 -
 73
73 -
 74
74 -
 75
75 -
 76
76 -
 77
77 -
 78
78 -
79
-
80
-
81
-
82
-
83
-
84
-
85
-
86
-
87
-
88
-
89
-
90
-
91
-
92
-
93
-
94
-
95
-
96
-
97
-
98
-
99
-
100
-
101
-
102
-
103
-
104
-
105
-
106
-
107
-
108
-
109
-
110
-
111
-
112
-
113
-
114
-
115
-
116
-
117
-
118
-
119
-
120
-
121
-
122
-
123
-
124
-
125
-
126
-
127
-
128
-
129
-
130
-
131
-
132
-
133
-
134
-
135
-
136
-
137
-
138
-
139
-
140
-
141
-
142
-
143
-
144
-
145
-
146
-
147
-
148
-
149
-
150
-
151
-
152
-
153
-
154
-
155
-
156
-
157
-
158
-
159
-
160
-
161
-
162
-
163
-
164
-
165
-
166
-
167
-
168
-
169
-
170
-
171
-
172
-
173
-
174
-
175
-
176
-
177
-
178
-
179
-
180
-
181
-
182
-
183
-
184
-
185
-
186
-
187
-
188
-
189
-
190
-
191
-
192
-
193
-
194
 |
 |
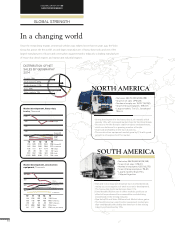
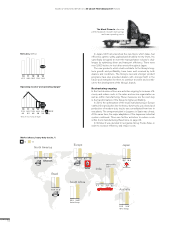
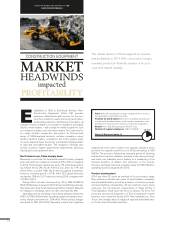
DISTRIBUTION OF NET
SALES BY GEOGRAPHY
2014
Europe, 38%
North America, 27%
South America, 10%
Asia, 18%
Other markets, 7%
200
400
600
800
1,000
Europe 30
N. America
Brazil
Japan
India
China
Europe 30
N. America
Brazil
Japan
India
China
13
240
236
104
34
132
774
14
228
270
93
42
155
744
12
222
250
87
32
195
636
11
242
216
111
25
237
882
10
179
142
102
25
212
1,015
Market development, heavy-duty
trucks, Thousands
100
200
300
400
Europe
N. America
S. America
China
Asia (excl. China)
Europe
N. America
S. America
China
Asia (excl. China)
13
118
166
46
261
201
14
125
185
38
216
196
12
122
164
44
253
199
11
125
112
42
399
177
10
94
82
35
371
141
Market development, construction
equipment, Thousands
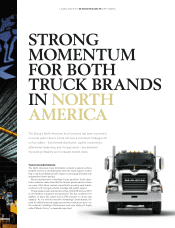
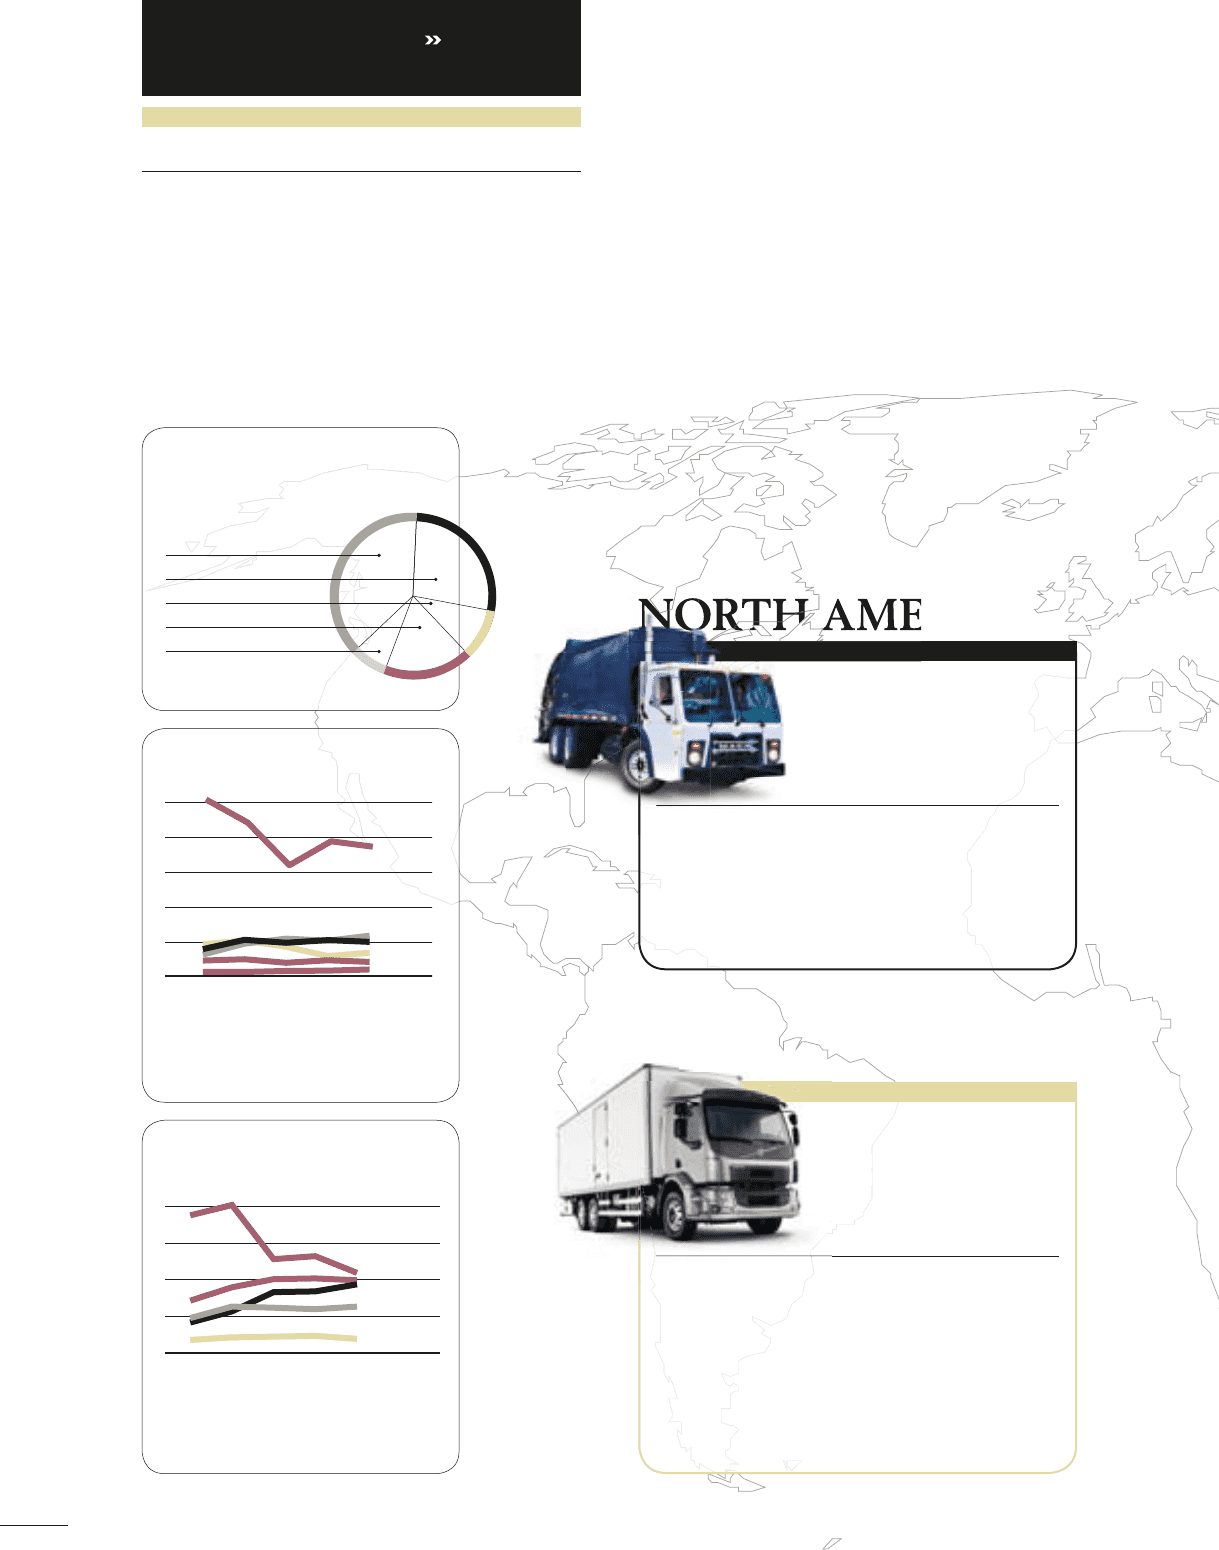
NORTH AMERICA
Since the streamlining towards commercial vehicles was initiated more than ten years ago, the Volvo
Group has grown into the world’s second largest manufacturer of heavy-duty trucks and one of the
largest manufacturers of buses and construction equipment and is today also a leading manufacturer
of heavy-duty diesel engines and marine and industrial engines.
In a changing world
A GLOBAL GROUP 2014
GROUP PERFORMANCE
GLOBAL STRENGTH
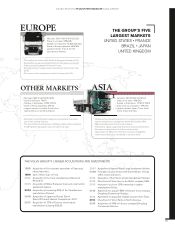
SOUTH AMERICA
• Net sales: SEK 76,258 M (63,088)
• Share of net sales: 27% (23)
• Number of employees: 15,217 (16,397)
• Share of Group employees: 16% (17)
• Largest markets: The U.S., Canada and
Mexico.
• Strong development in the heavy-duty truck market, which
grew by 14%, with increased market share for the Volvo Group.
• Successes for the Group’s captive engines and gearboxes,
which are delivered in a growing number of trucks.
• Improved profi tability in the truck business.
• The construction equipment market grew by 11% with good
growth in all segments of the market.
• Net sales: SEK 26,958 M (29,758)
• Share of net sales: 10% (11)
• Number of employees: 6,353 (6,275)
• Share of Group employees: 7% (6)
• Largest markets: Brazil, Peru,
Chile and Argentina.
• Demand in the important Brazilian truck market declined,
mainly as a consequence of weak economic development.
The heavy-duty truck market was down 11%.
• Considerable decline also in other markets, partly as an
effect of lower demand for commodities and declining
investments in the mining industry.
• New Volvo FH and Volvo FM launched. Market share gains.
• The South American construction equipment market was
also considerably affected by the downturn in the mining
industry and declined by 17%.
S
S
S
S
S
S
S
S
S
S
S
S
S
S
S
S
S
S
S
S
S
S
S
S
S
S
S
S
S
S
S
S
S
S
S
S
S
S
S
S
S
S
S
S
S
S
S
S
S
S
S
S
S
S
S
S
S
S
O
U
T
H
•
N
•
S
•
N
•
S
•
L
C
a
nt
B
•
Dem
and
in
th
ei
mpo
rta
a
T
T
H A
H
A
•
Net sales: SEK 76
•
Share of net sales
•
Number of em
p
lo
y
•
Share of Grou
p
e
m
•
L
arg
est markets:
T
M
e
xi
co
.
•
Strong development in the heavy
-
duty tr
64