Volvo 2014 Annual Report Download - page 116
Download and view the complete annual report
Please find page 116 of the 2014 Volvo annual report below. You can navigate through the pages in the report by either clicking on the pages listed below, or by using the keyword search tool below to find specific information within the annual report.-
 1
1 -
2
-
3
-
4
-
5
-
6
-
7
-
8
-
9
-
10
-
11
-
12
-
13
-
14
-
15
-
16
-
17
-
18
-
19
-
20
-
21
-
22
-
23
-
24
-
25
-
26
-
27
-
28
-
29
-
30
-
31
-
32
-
33
-
34
-
35
-
36
-
37
-
38
-
39
-
40
-
41
-
42
-
43
-
44
-
45
-
46
-
47
-
48
-
49
-
50
-
51
-
52
-
53
-
54
-
55
-
56
-
57
-
58
-
59
-
60
-
61
-
62
-
63
-
64
-
65
-
66
-
67
-
68
-
69
-
70
-
71
-
72
-
73
-
74
-
75
-
76
-
77
-
78
-
79
-
80
-
81
-
82
-
83
-
84
-
85
-
86
-
87
-
88
-
89
-
90
-
91
-
92
-
93
-
94
-
95
-
96
-
97
-
98
-
99
-
100
-
101
-
102
-
103
-
104
-
105
-
 106
106 -
 107
107 -
 108
108 -
 109
109 -
 110
110 -
 111
111 -
 112
112 -
 113
113 -
 114
114 -
 115
115 -
 116
116 -
 117
117 -
 118
118 -
 119
119 -
 120
120 -
 121
121 -
 122
122 -
 123
123 -
 124
124 -
 125
125 -
 126
126 -
127
-
128
-
129
-
130
-
131
-
132
-
133
-
134
-
135
-
136
-
137
-
138
-
139
-
140
-
141
-
142
-
143
-
144
-
145
-
146
-
147
-
148
-
149
-
150
-
151
-
152
-
153
-
154
-
155
-
156
-
157
-
158
-
159
-
160
-
161
-
162
-
163
-
164
-
165
-
166
-
167
-
168
-
169
-
170
-
171
-
172
-
173
-
174
-
175
-
176
-
177
-
178
-
179
-
180
-
181
-
182
-
183
-
184
-
185
-
186
-
187
-
188
-
189
-
190
-
191
-
192
-
193
-
194
 |
 |

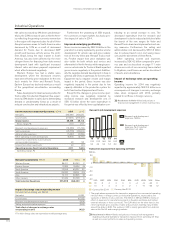
Net sales increased by 4% driven predominan-
tely by the 22% increased sales in North Amer-
ica refl ecting the growing economic momentum
in the region with improved sales for all of Volvo
Group’s business areas. In South America sales
decreased by 10% as a result of decreased
demand for Trucks due to decreased GDP
growth and business activity across the conti-
nent. Brazil, being the main market in South
America, has also been affected by the more
stringent terms for fi nancing from state owned
development bank with signifi cant increased
interest rates and down payment requirement
which affects demand negatively.
Western Europe has had a stable sales
development where the decreased volumes
have been offset by price realization for the new
truck models for Volvo and Renault Trucks.
Eastern Europe has declined mainly as a result
of the geopolitical uncertainties surrounding
Russia.
Sales development in Asia has been positive for
Trucks while Construction Equipment has experi-
enced a 25% decline in sales due to deteriorating
demand in predominately China as a result of
reduced construction and infrastructure projects.
Furthermore the weakening of SEK towards
the currencies in major markets has had a pos-
itive impact of sales in 2014.
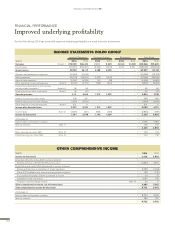
Improved underlying profi tability
Gross income increased by SEK 2.6 billion in the
year which is mainly explained by positive volume
development for vehicle sale and price realiza-
tion on the new Volvo and Renault Trucks mod-
els. Positive impact from price realization was
also visible for both vehicle and service and
aftermarket in North America while margin pres-
sure on vehicle sale for Trucks in Brazil impacted
gross income negatively in the period. Addition-
ally the negative demand development in Asia in
general, and China in particular, for Construction
Equipment had a negative volume and margin
impact in the period. Gross income was also
negatively impacted in the period due to low
capacity utilization in the production system for
both Construction Equipment and Trucks.
Except for the changes in gross income, oper-
ating income was negatively impacted by
increased research and development cost of
SEK 1.5 billion where the lower expenditure in
the period was offset by lower capitalization con-
tributing to an overall increase in cost. The
decreased expenditure level for research and
development is due to reduced activity level after
the launch of the new ranges for Volvo and
Renault Trucks brand and implemented cost sav-
ing measures. Furthermore the selling and
administrative cost decreased by SEK 1.6 billion
due to reduced launch cost, cost saving meas-
ures and the divestment of Volvo Rents.
Other operating income and expenses
increased by SEK 4.2 billion compared to previ-
ous year and as described on page 111 main
drivers are costs of non-recurring items related
to litigations, credit losses as well as divestment
of assets and subsidiaries.
Impact of exchange rates on operating
income
Operating income for 2014 was negatively
impacted by approximately SEK 0.4 billion as a
consequence of changes in currency exchange
rates when compared with 2013, primarily
related to net fl ows in foreign currency.
Read more in Note 4 Goal and policies in
fi nancial risk management in section Currency risks.
Income Statement Industrial Operations, SEK M 2014 2013
Net sales 275,999 265,420
Cost of sales (217,251) (209,307)
Gross income 58,748 56,113
Gross margin, % 21.3 21.1
Research and development expenses (16,656) (15,124)
Selling expenses (25,778) (26,904)
Administrative expenses (5,367) (5,824)
Other operating income and expenses (6,931) (2,710)
Income from investments in joint ventures
and associated companies 46 96
Income from other investments 49 (31)
Operating income (loss) Industrial Operations 4,111 5,616
Operating margin, % 1.5 2.1
Net sales by market area, SEK M 2014 2013 %
Western Europe 86,011 84,293 2
Eastern Europe 17,826 18,626 (4)
North America 73,358 60,237 22
South America 25,837 28,751 (10)
Asia 51,717 52,805 (2)
Other markets 21,249 20,708 3
Total Industrial Operations 275,999 265,420 4
Research and development expenses
131211
10
14.613.3
13.0
5.0
15.1
5.74.4
5.0
Research and development
expenses, SEK bn
Research and development
expenses, % of Industrial
Operations’ net sales
14
16.7
6.0
Industrial Operations
SEK bn
–40
–30
–20
–10
0
10
20
11
12
Other
–33
–36
SEK
–9
–9
KRW
–4
1
EUR
3
2
BRL
3
3
ZAR
3
3
CAD
4
4
NOK
6
7
GBP
16
13
USD
Currency flow 2014 Currency flow 2013
Transaction exposure from operating net fl ows1
1 The graph above represents the transaction exposure from commercial operating
net cash fl ows in foreign currency in Industrial Operations, expressed as net
surpluses or defi cits in key currencies. The defi cit in SEK and KRW is mainly an
effect of expenses for manufacturing plants in Sweden and Korea, but limited
external revenues in those currencies. The EUR defi cit on the other hand, is the
net of signifi cant gross volumes of sales and purchases made by many entities
around the globe in EUR. The surplus in USD is mainly generated from external
sales within the US and emerging markets.
Read more in Note 4 Goals and policies in fi nancial risk management
regarding Industrial Operations transaction exposure from operating net fl ows
as well as currency effects on sales and operating income.
Impact of exchange rates on operating income
Compared with preceding year, SEK M
Net sales16,498
Cost of sales (6,222)
Research and development expenses (254)
Selling and administrative expenses (444)
Total effect of changes in exchange rates
on operating income (422)
1 The Volvo Group sales are reported at monthly average rates.
112
FINANCIAL INFORMATION 2014