Volvo 2014 Annual Report Download - page 153
Download and view the complete annual report
Please find page 153 of the 2014 Volvo annual report below. You can navigate through the pages in the report by either clicking on the pages listed below, or by using the keyword search tool below to find specific information within the annual report.-
 1
1 -
2
-
3
-
4
-
5
-
6
-
7
-
8
-
9
-
10
-
11
-
12
-
13
-
14
-
15
-
16
-
17
-
18
-
19
-
20
-
21
-
22
-
23
-
24
-
25
-
26
-
27
-
28
-
29
-
30
-
31
-
32
-
33
-
34
-
35
-
36
-
37
-
38
-
39
-
40
-
41
-
42
-
43
-
44
-
45
-
46
-
47
-
48
-
49
-
50
-
51
-
52
-
53
-
54
-
55
-
56
-
57
-
58
-
59
-
60
-
61
-
62
-
63
-
64
-
65
-
66
-
67
-
68
-
69
-
70
-
71
-
72
-
73
-
74
-
75
-
76
-
77
-
78
-
79
-
80
-
81
-
82
-
83
-
84
-
85
-
86
-
87
-
88
-
89
-
90
-
91
-
92
-
93
-
94
-
95
-
96
-
97
-
98
-
99
-
100
-
101
-
102
-
103
-
104
-
105
-
106
-
107
-
108
-
109
-
110
-
111
-
112
-
113
-
114
-
115
-
116
-
117
-
118
-
119
-
120
-
121
-
122
-
123
-
124
-
125
-
126
-
127
-
128
-
129
-
130
-
131
-
132
-
133
-
134
-
135
-
136
-
137
-
138
-
139
-
140
-
141
-
142
-
 143
143 -
 144
144 -
 145
145 -
 146
146 -
 147
147 -
 148
148 -
 149
149 -
 150
150 -
 151
151 -
 152
152 -
 153
153 -
 154
154 -
 155
155 -
 156
156 -
 157
157 -
 158
158 -
 159
159 -
 160
160 -
 161
161 -
 162
162 -
 163
163 -
164
-
165
-
166
-
167
-
168
-
169
-
170
-
171
-
172
-
173
-
174
-
175
-
176
-
177
-
178
-
179
-
180
-
181
-
182
-
183
-
184
-
185
-
186
-
187
-
188
-
189
-
190
-
191
-
192
-
193
-
194
 |
 |

149
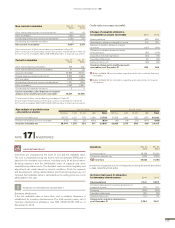
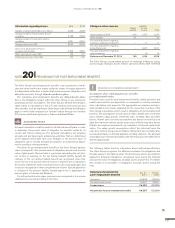
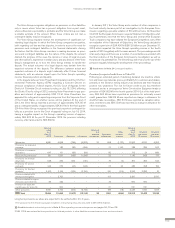
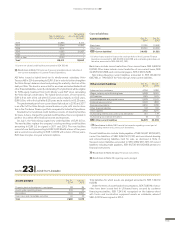
Assumptions applied for actuarial
calculations, % Dec 31,
2014 Dec 31,
2013
Sweden
Discount rate12.75 4.00
Expected salary increase 3.00 3.00
Infl ation 1.50 1.50
United States
Discount rate1 2 2.50–4.30 2.50–4.75
Expected salary increase 2.70–3.50 3.50
Infl ation 2.50 2.50
France
Discount rate11.50–2.00 3.25
Expected salary increase 2.50–3.00 3.00
Infl ation 1.50 1.50
Great Britain
Discount rate13.50–3.75 4.25–4.40
Expected salary increases 3.60–3.70 3.70–3.75
Infl ation 3.00 3.25
1 The discount rate for each country is determined by reference to market yields on
high-quality corporate bonds. In countries where there is no functioning market in
such bonds, the market yields on government bonds are used. The discount rate
for the Swedish pension obligation is determined by reference to mortgage bonds.
2 For all plans except two the discount rate used is within the range 3.60–4.30%
(3.75–4.75).
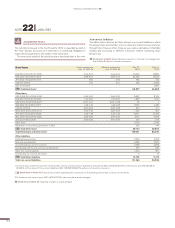
Pension costs 2014 2013
Current year service costs 1,298 1,297
Interest costs 1,479 1,319
Interest income (1,180) (842)
Past service costs 58 144
(Gain) loss on settlements (54) 0
Pension costs for the period,
defi ned-benefi t plans 1,601 1,918
Pension costs for defi ned-contribution plans 2,530 2,226
Total pension costs for the period 4,131 4,144
Costs for the period, post–employment
benefi ts other than pensions 2014 2013
Current year service costs 56 82
Interest costs 141 116
Interest income (2) (2)
Past service costs (37) 82
(Gain) loss on settlements – 1
Remeasurements (55) 7
Total costs for the period, post–employment
benefi ts other than pensions 103 286
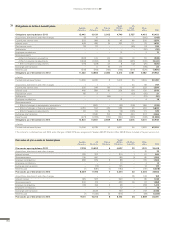
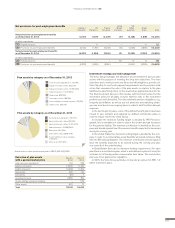
− +
Effect on obligation, SEK M
If discount rate increases 0.5% If discount rate decreases 0.5%
Sweden Pensions
Sweden Pensions
US Pensions
US Pensions
US Other benefits
US Other benefits
France Pensions
France Pensions
Great Britain Pensions
Great Britain Pensions
If inflation decreases 0.5% If inflation increases 0.5%
(1,667)
(854)
(204)
1,807
941
220
(539)
(176)
618
193
(1,667) 1,807
0
(5)
0
5
(422)
(17) 19
473
Sensitivity analysis
Sweden
Pensions US
Pensions France
Pensions Great Britain
Pensions US
Other benefi ts
Average duration of the obligation, years 21.9 10.9 15.5 17.7 10.7
The analysis below presents the sensitivity on the defi ned benefi t
obligations when changes in the applied assumptions for discount rate
and infl ation are made. The sensitivity analysis is based on a change in
an assump tion while holding all other assumptions constant. In practice,
thisis not probable, and changes in some of the assumptions may be
correlated.
FINANCIAL INFORMATION 2014