Volvo 2014 Annual Report Download - page 138
Download and view the complete annual report
Please find page 138 of the 2014 Volvo annual report below. You can navigate through the pages in the report by either clicking on the pages listed below, or by using the keyword search tool below to find specific information within the annual report.-
 1
1 -
2
-
3
-
4
-
5
-
6
-
7
-
8
-
9
-
10
-
11
-
12
-
13
-
14
-
15
-
16
-
17
-
18
-
19
-
20
-
21
-
22
-
23
-
24
-
25
-
26
-
27
-
28
-
29
-
30
-
31
-
32
-
33
-
34
-
35
-
36
-
37
-
38
-
39
-
40
-
41
-
42
-
43
-
44
-
45
-
46
-
47
-
48
-
49
-
50
-
51
-
52
-
53
-
54
-
55
-
56
-
57
-
58
-
59
-
60
-
61
-
62
-
63
-
64
-
65
-
66
-
67
-
68
-
69
-
70
-
71
-
72
-
73
-
74
-
75
-
76
-
77
-
78
-
79
-
80
-
81
-
82
-
83
-
84
-
85
-
86
-
87
-
88
-
89
-
90
-
91
-
92
-
93
-
94
-
95
-
96
-
97
-
98
-
99
-
100
-
101
-
102
-
103
-
104
-
105
-
106
-
107
-
108
-
109
-
110
-
111
-
112
-
113
-
114
-
115
-
116
-
117
-
118
-
119
-
120
-
121
-
122
-
123
-
124
-
125
-
126
-
127
-
 128
128 -
 129
129 -
 130
130 -
 131
131 -
 132
132 -
 133
133 -
 134
134 -
 135
135 -
 136
136 -
 137
137 -
 138
138 -
 139
139 -
 140
140 -
 141
141 -
 142
142 -
 143
143 -
 144
144 -
 145
145 -
 146
146 -
 147
147 -
 148
148 -
149
-
150
-
151
-
152
-
153
-
154
-
155
-
156
-
157
-
158
-
159
-
160
-
161
-
162
-
163
-
164
-
165
-
166
-
167
-
168
-
169
-
170
-
171
-
172
-
173
-
174
-
175
-
176
-
177
-
178
-
179
-
180
-
181
-
182
-
183
-
184
-
185
-
186
-
187
-
188
-
189
-
190
-
191
-
192
-
193
-
194
 |
 |

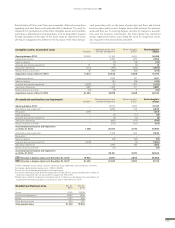
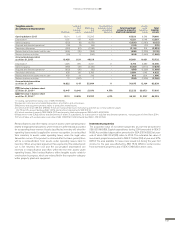
2013 Trucks Con struction
Equipment Buses Volvo Penta
Corporate
functions, Group
functions& Other
incl. elim. Industrial
Operations Customer
Finance Elimina-
tions Volvo
Group
Net sales, external
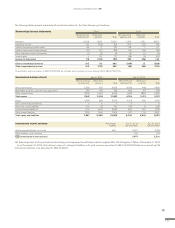
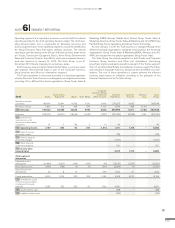
customers 176,503 52,770 16,267 7,343 10,889 263,772 8,850 – 272,622
Net sales, internal 1,971 667 440 207 (1,637) 1,648 689 (2,337) –
I/S Net sales 178,474 53,437 16,707 7,550 9,252 265,420 9,539 (2,337) 272,622
Expenses (172,397) (50,846) (16,910) (6,924) (12,824) (259,901) (8,017) 2,337 (265,580)
I/S Income from invest-
ments in joint ventures and
associated companies 68 – 14 – 14 96 – – 96
I/S Operating income 6,145 2,592 (190) 626 (3,557) 5,616 1,522 – 7,138
I/S Interest income and
similar credits 381 – – 381
I/S Interest expense
and similar charges (2,810) – – (2,810)
I/S Other fi nancial
income and expense 11 – – 11
I/S Income after
fi nancial items 3,199 1,522 – 4,721
Other segment
information
Depreciation and
amortization (9,461) (2,049) (376) (307) (2,279) (14,472) (2,949) – (17,422)
Restructuring costs (667) (5) 22 – (53) (702) (5) – (707)
Gains/losses from
divestments 115 100 – – (1,572) (1,357) (3) – (1,360)
Capital expenditure 8,753 2,475 386 254 2,025 13,892 6,832 (52) 20,672
B/S Investments in joint
ventures and associated
companies (the equity
method) 2,406 – 165 29 1,776 4,377 – – 4,377
B/S Assets held for sale
(total assets) 8,104 – –8,104
B/S Assets held for sale
(total liabilities) (350) – –(350)
Internal sales between segments are generally made at standard cost of sales,
including calculated interest and product improvement expenses.
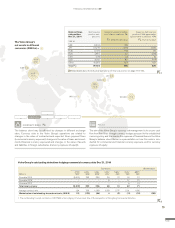
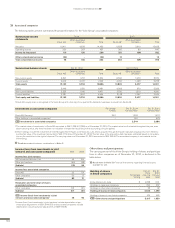
Reporting by market Net sales Non-current assets1
2014 2013 2014 2013
Europe 106,176 105,296 76,016 72,627
of which Sweden 8,042 9,020 25,452 25,929
of which France 20,733 21,886 19,885 19,089
North America 76,258 63,074 21,317 17,900
of which USA 60,810 49,727 18,034 14,649
South America 26,958 29,751 2,896 2,271
of which Brazil 19,260 20,939 2,434 1,861
Asia 52,076 53,500 22,198 20,774
of which China 12,374 15,949 2,678 2,404
of which Japan 14,382 14,219 13,876 13,814
Other markets 21,481 21,001 1,087 923
I/S B/S Total 282,948 272,622 123,515 114,494
1 Non-current assets include intangible and tangible assets.
The reporting of net sales by market is based on where the delivery of the
goods took place.
The Volvo Group’s recognized net sales pertain mainly to revenues from
sales of goods and services. Net sales are, if the occasion arises, reduced
by the value of discounts granted and by returns.
Revenue from the sale of goods is recognized when signifi cant risks
and rewards of ownership have been transferred to external parties, nor-
mally when the goods are delivered to the customer.
However, if the sale of goods is combined with a buy-back agreement
or a residual value guarantee, the transaction is recognized as an operat-
ing lease transaction if signifi cant risks in regard to the goods are retained
in Volvo Group. Revenue is then recognized over the period of the residual
value commitment. If the residual value risk commitment is not signifi cant
or the sale was made to an independent party before Volvo Group is com-
mitted to the residual value risk the revenue is recognized at the time of
sale and a provision is made to refl ect the estimated residual value risk.
Read more in Note 21 Other provisions, for a description of residual value
risks.
ACCOUNTING POLICY
REVENUE
NOTE 7
FINANCIAL INFORMATION 2014
134