Volvo 2014 Annual Report Download - page 121
Download and view the complete annual report
Please find page 121 of the 2014 Volvo annual report below. You can navigate through the pages in the report by either clicking on the pages listed below, or by using the keyword search tool below to find specific information within the annual report.-
 1
1 -
2
-
3
-
4
-
5
-
6
-
7
-
8
-
9
-
10
-
11
-
12
-
13
-
14
-
15
-
16
-
17
-
18
-
19
-
20
-
21
-
22
-
23
-
24
-
25
-
26
-
27
-
28
-
29
-
30
-
31
-
32
-
33
-
34
-
35
-
36
-
37
-
38
-
39
-
40
-
41
-
42
-
43
-
44
-
45
-
46
-
47
-
48
-
49
-
50
-
51
-
52
-
53
-
54
-
55
-
56
-
57
-
58
-
59
-
60
-
61
-
62
-
63
-
64
-
65
-
66
-
67
-
68
-
69
-
70
-
71
-
72
-
73
-
74
-
75
-
76
-
77
-
78
-
79
-
80
-
81
-
82
-
83
-
84
-
85
-
86
-
87
-
88
-
89
-
90
-
91
-
92
-
93
-
94
-
95
-
96
-
97
-
98
-
99
-
100
-
101
-
102
-
103
-
104
-
105
-
106
-
107
-
108
-
109
-
110
-
 111
111 -
 112
112 -
 113
113 -
 114
114 -
 115
115 -
 116
116 -
 117
117 -
 118
118 -
 119
119 -
 120
120 -
 121
121 -
 122
122 -
 123
123 -
 124
124 -
 125
125 -
 126
126 -
 127
127 -
 128
128 -
 129
129 -
 130
130 -
 131
131 -
132
-
133
-
134
-
135
-
136
-
137
-
138
-
139
-
140
-
141
-
142
-
143
-
144
-
145
-
146
-
147
-
148
-
149
-
150
-
151
-
152
-
153
-
154
-
155
-
156
-
157
-
158
-
159
-
160
-
161
-
162
-
163
-
164
-
165
-
166
-
167
-
168
-
169
-
170
-
171
-
172
-
173
-
174
-
175
-
176
-
177
-
178
-
179
-
180
-
181
-
182
-
183
-
184
-
185
-
186
-
187
-
188
-
189
-
190
-
191
-
192
-
193
-
194
 |
 |
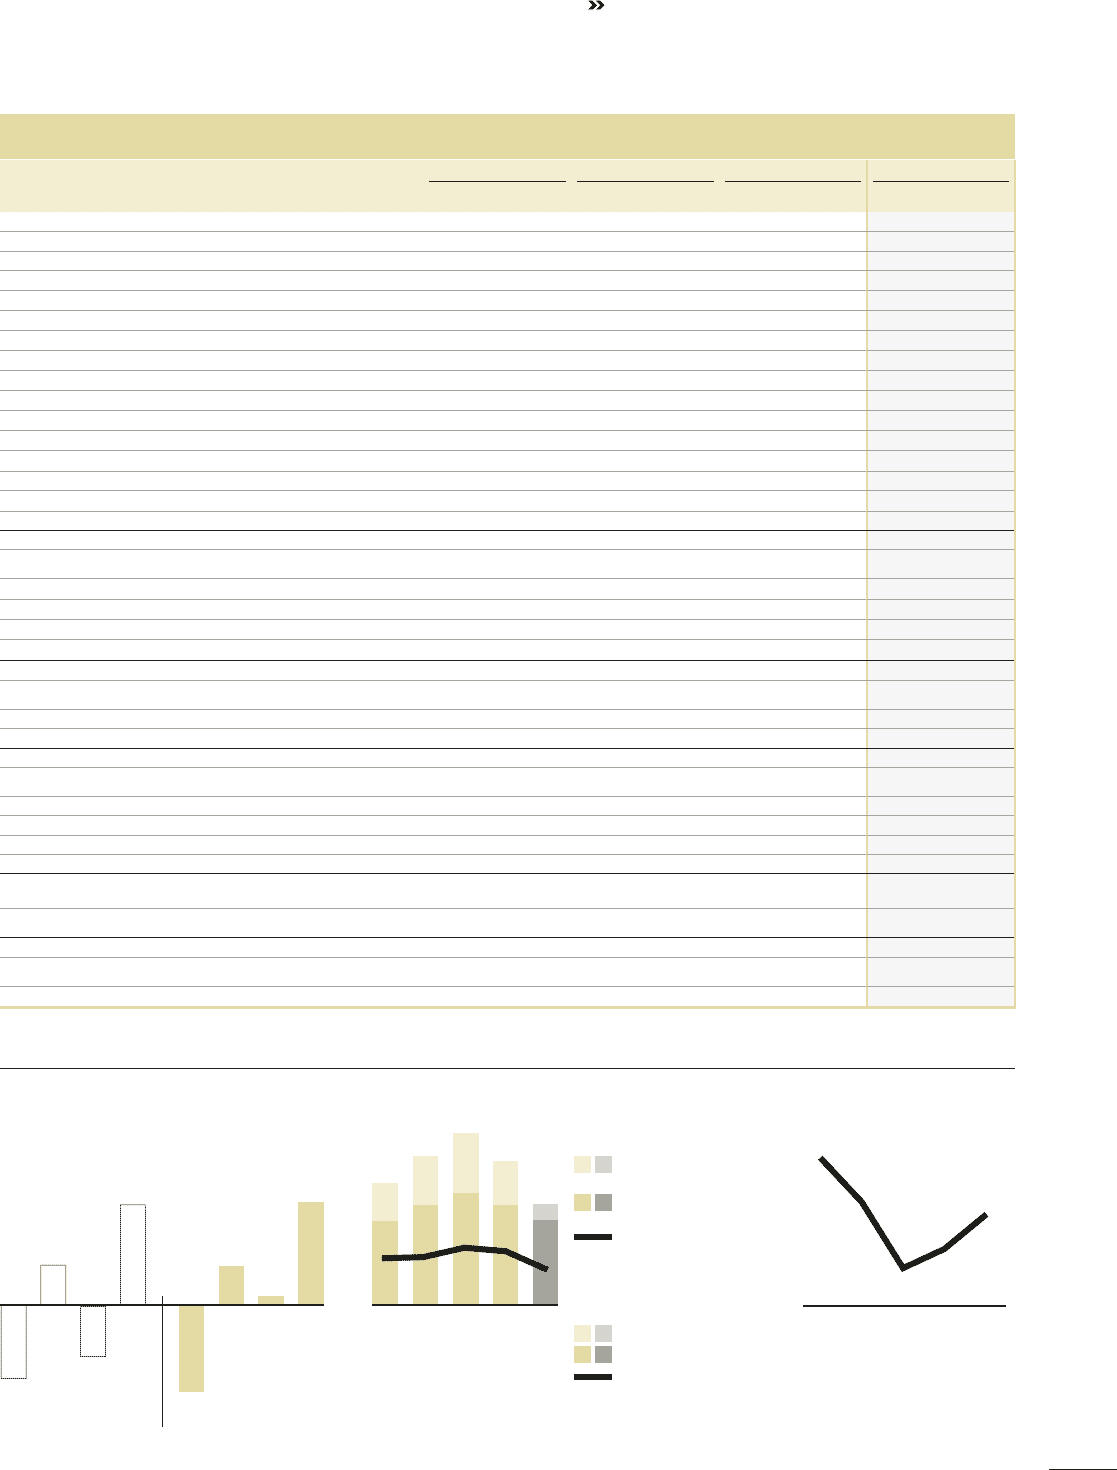
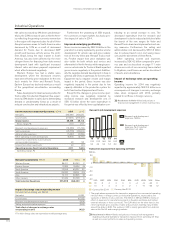
Capital expenditures, Industrial Operations
13
12
11
10
Capital expenditures,
% of net sales
14
4.0
7.1
4.1
8.5
4.9
9.5
4.6 3.1
8.5
Property, plant and
equipment, SEK bn
Capitalized development
costs, SEK bn
3.2 4.1 5.1 3.7
7.2
1.4
Self-fi nancing ratio,
Industrial Operations %
Cash-flow from operating activities
divided by net investments in fixed
assets and leasing assets.
13121110
72
14
112 180210294
Operating cash fl ow,
Industrial Operations, SEK bn
20142013
Q4
10.6
Q3
0.9
Q2
4.0
Q1
(9.0)
Q4
10.3
Q3
(5.3)
Q2
4.1
Q1
(7.6)
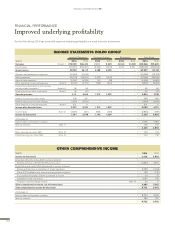
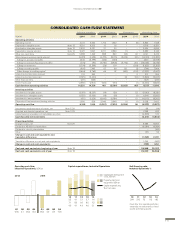
CONSOLIDATED CASH FLOW STATEMENT
Industrial operations Customer Finance Eliminations Volvo Group Total
SEK M 2014 2013 2014 2013 2014 2013 2014 2013
Operating activities
Operating income 4,103 5,624 1,712 1,522 8 (8) 5,823 7,138
Depreciation tangible assets Note 13 6,701 6,205 15 16 – – 6,716 6,221
Amortization intangible assets Note 12 3,503 5,021 31 34 – – 3,534 5,055
Depreciation leasing vehicles Note 13 2,470 3,247 3,211 2,899 (1) – 5,680 6,146
Other non-cash items Note 29 5,288 1,496 888 890 (35) 30 6,141 2,416
Total change in working capital whereof (3,272) (1,956) (4,772) (8,774) (6,059) (35) (14,103) (10,765)
Change in accounts receivable 1,346 (4,799) (133) (120) ––1,213 (4,919)
Change in customer-fi nancing receivables (144) (91) (4,740) (8,923) (5,756) 284 (10,640) (8,730)
Change in inventories (1,594) (3,209) (28) 114 – (168) (1,622) (3,263)
Change in trade payables (995) 7,905 65 60 131 (1) (799) 7,964
Other changes in working capital (1,884) (1,762) 64 95 (435) (150) (2,255) (1,817)
Interest and similar items received 317 362 – – – 2 317 364
Interest and similar items paid (1,879) (2,404) – – 33 (33) (1,846) (2,437)
Other fi nancial items (221) (225) – – – – (221) (225)
Income ta xes paid (2,680) (2,641) (624) (181) – (1) (3,304) (2,823)
Cash fl ow from operating activities 14,331 14,729 461 (3,594) (6,055) (45) 8,737 11,090
Investing activities
Investments in tangible assets (7,079) (8,307) (14) (26) – 52 (7,093) (8,281)
Investments in intangible assets (1,523) (3,903) (18) (18) – (1) (1,541) (3,922)
Investment in leasing vehicles (470) (1,529) (9,645) (6,784) – 51 (10,115) (8,262)
Disposals of fi xed assets and leasing vehicles 1,090 556 3,949 2,848 (1) (1) 5,038 3,403
Operating cash fl ow 6,349 1,546 (5,267) (7,574) (6,056) 56 (4.973) (5,972)
Investments and divestments of shares, net Note 5, 29 69 (14)
Acquired and divested operations, net Note 3, 29 7,398 932
Interest-bearing receivables incl marketable securities (4,808) 510
Cash fl ow after net investments (2,314) (4,544)
Financing activities
Change in loans, net Note 29 6,686 12,955
Dividend to AB Volvo’s shareholders (6,084) (6,084)
Dividend to minority shareholders –(162)
Other (57) 56
Change in cash and cash equivalents excl.
translation differences (1,769) 2,221
Translation difference on cash and cash equivalents 1,044 (460)
Change in cash and cash equivalents (725) 1,761
Cash and cash equivalents, beginning of year Note 18 26,96825,207
Cash and cash equivalents, end of year Note 18 26,242 26,968
FINANCIAL INFORMATION 2014
117