Vodafone 2007 Annual Report Download - page 96
Download and view the complete annual report
Please find page 96 of the 2007 Vodafone annual report below. You can navigate through the pages in the report by either clicking on the pages listed below, or by using the keyword search tool below to find specific information within the annual report.-
 1
1 -
2
-
3
-
4
-
5
-
6
-
7
-
8
-
9
-
10
-
11
-
12
-
13
-
14
-
15
-
16
-
17
-
18
-
19
-
20
-
21
-
22
-
23
-
24
-
25
-
26
-
27
-
28
-
29
-
30
-
31
-
32
-
33
-
34
-
35
-
36
-
37
-
38
-
39
-
40
-
41
-
42
-
43
-
44
-
45
-
46
-
47
-
48
-
49
-
50
-
51
-
52
-
53
-
54
-
55
-
56
-
57
-
58
-
59
-
60
-
61
-
62
-
63
-
64
-
65
-
66
-
67
-
68
-
69
-
70
-
71
-
72
-
73
-
74
-
75
-
76
-
77
-
78
-
79
-
80
-
81
-
82
-
83
-
84
-
85
-
 86
86 -
 87
87 -
 88
88 -
 89
89 -
 90
90 -
 91
91 -
 92
92 -
 93
93 -
 94
94 -
 95
95 -
 96
96 -
 97
97 -
 98
98 -
 99
99 -
 100
100 -
 101
101 -
 102
102 -
 103
103 -
 104
104 -
 105
105 -
 106
106 -
107
-
108
-
109
-
110
-
111
-
112
-
113
-
114
-
115
-
116
-
117
-
118
-
119
-
120
-
121
-
122
-
123
-
124
-
125
-
126
-
127
-
128
-
129
-
130
-
131
-
132
-
133
-
134
-
135
-
136
-
137
-
138
-
139
-
140
-
141
-
142
-
143
-
144
-
145
-
146
-
147
-
148
-
149
-
150
-
151
-
152
-
153
-
154
-
155
-
156
-
157
-
158
-
159
-
160
-
161
-
162
-
163
-
164
 |
 |

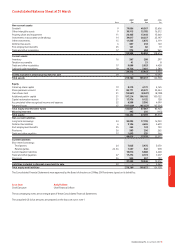
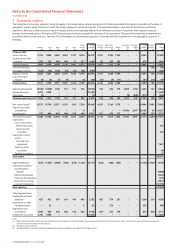
94 Vodafone Group Plc Annual Report 2007
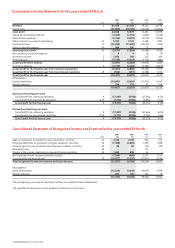
Consolidated Cash Flow Statement for the years ended 31 March
2007 2007 2006 2005
Note $m £m £m £m
Net cash flows from operating activities 29,32 20,331 10,328 11,841 10,979
Cash flows from investing activities
Purchase of interests in subsidiary undertakings and joint ventures,
net of cash acquired (5,522) (2,805) (4,186) (2,461)
Disposal of interests in subsidiary undertakings, net of cash disposed 13,321 6,767 599 444
Disposal of interests in associated undertakings 6,140 3,119 ––
Purchase of intangible assets (1,770) (899) (690) (699)
Purchase of property, plant and equipment (7,152) (3,633) (4,481) (4,279)
Disposal of property, plant and equipment 67 34 26 68
Purchase of investments (339) (172) (57) (19)
Disposal of investments 157 80 122
Loans to businesses sold or acquired businesses held for sale – – – 110
Dividends received from associated undertakings 1,557 791 835 1,896
Dividends received from investments 112 57 41 19
Interest received 1,035 526 319 339
Net cash flows from investing activities 29 7,606 3,865 (7,593) (4,560)
Cash flows from financing activities
Issue of ordinary share capital and reissue of treasury shares 380 193 356 115
Net movement in short term borrowings 1,876 953 708 –
Proceeds from the issue of long term borrowings 10,138 5,150 5,256 –
Repayment of borrowings (3,860) (1,961) (1,371) (1,824)
Loans repaid to associated undertakings – – (47) (2)
Purchase of treasury shares (85) (43) (6,457) (4,053)
B share capital redemption (11,246) (5,713) ––
B share preference dividends paid (6,478) (3,291) ––
Equity dividends paid (6,998) (3,555) (2,749) (1,991)
Dividends paid to minority shareholders in subsidiary undertakings (67) (34) (51) (32)
Interest paid (2,069) (1,051) (721) (744)
Net cash flows used in financing activities 29 (18,409) (9,352) (5,076) (8,531)
Net cash flows 9,528 4,841 (828) (2,112)
Cash and cash equivalents at beginning of the financial year 18 5,772 2,932 3,726 5,809
Exchange (loss)/gain on cash and cash equivalents (620) (315) 34 29
Cash and cash equivalents at end of the financial year 18 14,680 7,458 2,932 3,726
The accompanying notes are an integral part of these Consolidated Financial Statements.
The unaudited US dollar amounts are prepared on the basis set out in note 1.