Vodafone 2007 Annual Report Download - page 110
Download and view the complete annual report
Please find page 110 of the 2007 Vodafone annual report below. You can navigate through the pages in the report by either clicking on the pages listed below, or by using the keyword search tool below to find specific information within the annual report.-
 1
1 -
2
-
3
-
4
-
5
-
6
-
7
-
8
-
9
-
10
-
11
-
12
-
13
-
14
-
15
-
16
-
17
-
18
-
19
-
20
-
21
-
22
-
23
-
24
-
25
-
26
-
27
-
28
-
29
-
30
-
31
-
32
-
33
-
34
-
35
-
36
-
37
-
38
-
39
-
40
-
41
-
42
-
43
-
44
-
45
-
46
-
47
-
48
-
49
-
50
-
51
-
52
-
53
-
54
-
55
-
56
-
57
-
58
-
59
-
60
-
61
-
62
-
63
-
64
-
65
-
66
-
67
-
68
-
69
-
70
-
71
-
72
-
73
-
74
-
75
-
76
-
77
-
78
-
79
-
80
-
81
-
82
-
83
-
84
-
85
-
86
-
87
-
88
-
89
-
90
-
91
-
92
-
93
-
94
-
95
-
96
-
97
-
98
-
99
-
 100
100 -
 101
101 -
 102
102 -
 103
103 -
 104
104 -
 105
105 -
 106
106 -
 107
107 -
 108
108 -
 109
109 -
 110
110 -
 111
111 -
 112
112 -
 113
113 -
 114
114 -
 115
115 -
 116
116 -
 117
117 -
 118
118 -
 119
119 -
 120
120 -
121
-
122
-
123
-
124
-
125
-
126
-
127
-
128
-
129
-
130
-
131
-
132
-
133
-
134
-
135
-
136
-
137
-
138
-
139
-
140
-
141
-
142
-
143
-
144
-
145
-
146
-
147
-
148
-
149
-
150
-
151
-
152
-
153
-
154
-
155
-
156
-
157
-
158
-
159
-
160
-
161
-
162
-
163
-
164
 |
 |

108 Vodafone Group Plc Annual Report 2007
Notes to the Consolidated Financial Statements
continued
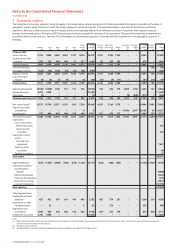
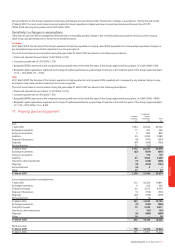
9. Intangible assets
Licences and Computer
Goodwill spectrum fees software Other Total
£m £m £m £m £m
Cost:
1 April 2005 73,179 15,573 2,928 29 91,709
Exchange movements 1,291 216 51 22 1,580
Arising on acquisition 2,802 1,196 20 699 4,717
Additions – 6 616 10 632
Disposals (1,142) – (43) (5) (1,190)
31 March 2006 76,130 16,991 3,572 755 97,448
Exchange movements (2,321) (431) (55) (99) (2,906)
Arising on acquisition 1,746 707 18 257 2,728
Additions – 308 799 – 1,107
Transfer to other investments (487) (319) – (48) (854)
Disposals – – (29) – (29)
31 March 2007 75,068 17,256 4,305 865 97,494
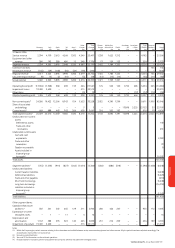
Accumulated impairment losses and amortisation:
1 April 2005 475 1,291 1,851 4 3,621
Exchange movements 513 38 33 4 588
Amortisation charge for the year – 1,030 493 102 1,625
Impairment losses 23,515 – – – 23,515
Disposals (979) – (38) (2) (1,019)
31 March 2006 23,524 2,359 2,339 108 28,330
Exchange movements (623) (61) (45) (14) (743)
Amortisation charge for the year – 1,088 719 293 2,100
Impairment losses 11,600 – – – 11,600
Transfer to other investments – (30) – (11) (41)
Disposals – – (24) – (24)
31 March 2007 34,501 3,356 2,989 376 41,222
Net book value:
31 March 2007 40,567 13,900 1,316 489 56,272
31 March 2006 52,606 14,632 1,233 647 69,118
For the additions in the year, the weighted average life of licences and spectrum fees is 14 years, the weighted average life of computer software is four years
and the weighted average life of total additions is seven years. For licences and spectrum fees and other intangible assets, amortisation is included within the
cost of sales line within the Income Statement.
The net book value at 31 March 2007 and expiry dates of the most significant purchased licences are as follows:
2007 2006
Expiry date £m £m
Germany December 2020 4,684 5,165
UK December 2021 4,912 5,245