Vodafone 2007 Annual Report Download - page 53
Download and view the complete annual report
Please find page 53 of the 2007 Vodafone annual report below. You can navigate through the pages in the report by either clicking on the pages listed below, or by using the keyword search tool below to find specific information within the annual report.-
 1
1 -
2
-
3
-
4
-
5
-
6
-
7
-
8
-
9
-
10
-
11
-
12
-
13
-
14
-
15
-
16
-
17
-
18
-
19
-
20
-
21
-
22
-
23
-
24
-
25
-
26
-
27
-
28
-
29
-
30
-
31
-
32
-
33
-
34
-
35
-
36
-
37
-
38
-
39
-
40
-
41
-
42
-
 43
43 -
 44
44 -
 45
45 -
 46
46 -
 47
47 -
 48
48 -
 49
49 -
 50
50 -
 51
51 -
 52
52 -
 53
53 -
 54
54 -
 55
55 -
 56
56 -
 57
57 -
 58
58 -
 59
59 -
 60
60 -
 61
61 -
 62
62 -
 63
63 -
64
-
65
-
66
-
67
-
68
-
69
-
70
-
71
-
72
-
73
-
74
-
75
-
76
-
77
-
78
-
79
-
80
-
81
-
82
-
83
-
84
-
85
-
86
-
87
-
88
-
89
-
90
-
91
-
92
-
93
-
94
-
95
-
96
-
97
-
98
-
99
-
100
-
101
-
102
-
103
-
104
-
105
-
106
-
107
-
108
-
109
-
110
-
111
-
112
-
113
-
114
-
115
-
116
-
117
-
118
-
119
-
120
-
121
-
122
-
123
-
124
-
125
-
126
-
127
-
128
-
129
-
130
-
131
-
132
-
133
-
134
-
135
-
136
-
137
-
138
-
139
-
140
-
141
-
142
-
143
-
144
-
145
-
146
-
147
-
148
-
149
-
150
-
151
-
152
-
153
-
154
-
155
-
156
-
157
-
158
-
159
-
160
-
161
-
162
-
163
-
164
 |
 |

Vodafone Group Plc Annual Report 2007 51
PerformancePerformance
Non-voice service revenue increased by more than 100% compared with
the 2005 financial year and represented 8.9% of service revenue for the
2006 financial year. Continued increases in messaging revenue were
augmented by strong growth from data products, including Verizon
Wireless’ consumer broadband multimedia offering, wireless email and
broadband data card service. At the end of the 2006 financial year, Verizon
Wireless’ next-generation EV-DO network was available to about 150 million
people, approximately half the US population. This investment paved the
way for the launch of innovative new data services in areas such as full track
music downloads and location based services.
In local currency, the Group’s share of Verizon Wireless’ operating profit
increased by 21.5%, driven by revenue growth and a leading cost efficiency
position in the US market. The Group’s share of the tax attributable to
Verizon Wireless of £116 million for the year ended 31 March 2006 relates
only to the corporate entities held by the Verizon Wireless partnership. The
tax attributable to the Group’s share of the partnership’s pre-tax profit is
included within the Group tax charge.
Vodafone and Verizon Wireless were engaged in a number of joint projects,
predominantly focusing upon bringing global services to their customers.
The 2006 financial year saw the introduction of two new data roaming
services for Verizon Wireless customers, in addition to the launch of new
handsets for the global phone proposition, all of which leverage the
Vodafone footprint.
Verizon Wireless continued to strengthen its spectrum position with the
completion of the purchase of several key spectrum licences, including
licences from Nextwave, Leap Wireless and Metro PCS and through
participation in the FCC’s Auction 58, which took place in February 2005,
with licences being granted in May 2005.
The other associates in the EMAPA region achieved growth of 6.4% in the
share of results of associates which was primarily driven by SFR, the Group’s
associated undertaking in France, which reported strong growth in revenue
and operating profit, principally as a result of an 8.1% increase in average
customers compared with the 2005 financial year. Usage of both voice and
non-voice services increased in the year and SFR had a total of 5,268,000
Vodafone live! customers at 31 March 2006. SFR continues to grow its 3G
base and at 31 March 2006 had registered 1,352,000 3G devices on its
network. On 30 November 2005, the French competition authority fined
SFR 220 million for engaging in anti-competitive agreements that
distorted market competition.
Investments
China Mobile, in which the Group has a 3.27% stake, and is accounted for as
an investment, grew its customer base by 21.9% in the year to 260.6 million
at 31 March 2006. Dividends of £41 million were received in the 2006
financial year.
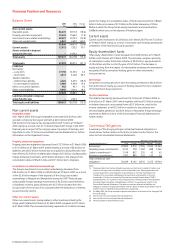
Common Functions
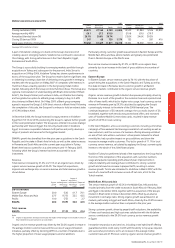
2006 2005 Change
£m £m %
Revenue 145 123 17.9
Adjusted operating profit/(loss) 211 (85)
Common functions include the results of Partner Markets and unallocated
central Group costs and charges. Adjusted operating profit increased
primarily due to a revision of the charges made to Vodafone operating
companies for the use of the Vodafone brand and related trademarks which
took effect from 1 April 2005.
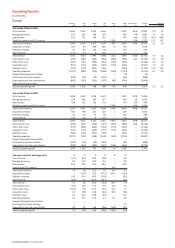
US GAAP Reconciliation
The principal differences between US GAAP and IFRS, as they relate to the
Consolidated Financial Statements, are the accounting for goodwill and
intangible assets before 29 September 2004, the accounting for income
taxes, the capitalisation of interest and the timing of recognition of
connection revenue and expenses.
In the year ended 31 March 2007, revenue from continuing operations
under US GAAP was £25,359 million compared with revenue from
continuing operations under IFRS of £31,104 million for the same period.
The difference relates to the equity accounting of Vodafone Italy under
US GAAP compared to proportionate consolidation under IFRS and the
release of connection revenue deferred prior to the adoption of EITF 00-21
on 1 October 2003, which is required to be recognised over the period a
customer is expected to remain connected to the network under US GAAP.
Net loss under US GAAP for the year ended 31 March 2007 was £4,325
million, compared with a loss for the financial year under IFRS of £5,297
million for the same period. The lower net loss under US GAAP was mainly
driven by higher amortisation charges of other intangible assets and share
of results in equity method investments, more than offset by income taxes
and the reversal of impairment losses.
The reconciliation of the differences between IFRS and US GAAP is provided
in note 38 to the Consolidated Financial Statements.