Vodafone 2007 Annual Report Download - page 95
Download and view the complete annual report
Please find page 95 of the 2007 Vodafone annual report below. You can navigate through the pages in the report by either clicking on the pages listed below, or by using the keyword search tool below to find specific information within the annual report.-
 1
1 -
2
-
3
-
4
-
5
-
6
-
7
-
8
-
9
-
10
-
11
-
12
-
13
-
14
-
15
-
16
-
17
-
18
-
19
-
20
-
21
-
22
-
23
-
24
-
25
-
26
-
27
-
28
-
29
-
30
-
31
-
32
-
33
-
34
-
35
-
36
-
37
-
38
-
39
-
40
-
41
-
42
-
43
-
44
-
45
-
46
-
47
-
48
-
49
-
50
-
51
-
52
-
53
-
54
-
55
-
56
-
57
-
58
-
59
-
60
-
61
-
62
-
63
-
64
-
65
-
66
-
67
-
68
-
69
-
70
-
71
-
72
-
73
-
74
-
75
-
76
-
77
-
78
-
79
-
80
-
81
-
82
-
83
-
84
-
 85
85 -
 86
86 -
 87
87 -
 88
88 -
 89
89 -
 90
90 -
 91
91 -
 92
92 -
 93
93 -
 94
94 -
 95
95 -
 96
96 -
 97
97 -
 98
98 -
 99
99 -
 100
100 -
 101
101 -
 102
102 -
 103
103 -
 104
104 -
 105
105 -
106
-
107
-
108
-
109
-
110
-
111
-
112
-
113
-
114
-
115
-
116
-
117
-
118
-
119
-
120
-
121
-
122
-
123
-
124
-
125
-
126
-
127
-
128
-
129
-
130
-
131
-
132
-
133
-
134
-
135
-
136
-
137
-
138
-
139
-
140
-
141
-
142
-
143
-
144
-
145
-
146
-
147
-
148
-
149
-
150
-
151
-
152
-
153
-
154
-
155
-
156
-
157
-
158
-
159
-
160
-
161
-
162
-
163
-
164
 |
 |

Vodafone Group Plc Annual Report 2007 93
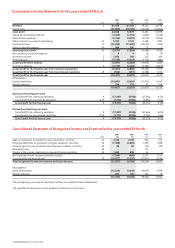
Financials
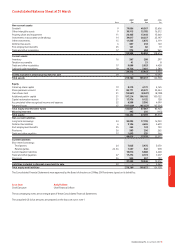
Consolidated Balance Sheet at 31 March
2007 2007 2006
Note $m £m £m
Non-current assets
Goodwill 979,856 40,567 52,606
Other intangible assets 930,915 15,705 16,512
Property, plant and equipment 11 26,465 13,444 13,660
Investments in associated undertakings 14 39,817 20,227 23,197
Other investments 15 11,565 5,875 2,119
Deferred tax assets 6807 410 140
Post employment benefits 25 161 82 19
Trade and other receivables 17 972 494 361
190,558 96,804 108,614
Current assets
Inventory 16 567 288 297
Taxation recoverable 41 21 8
Trade and other receivables 17 9,888 5,023 4,438
Cash and cash equivalents 18 14,726 7,481 2,789
25,222 12,813 7,532
Assets included in disposal group held for sale 29 ––10,592
Total assets 215,780 109,617 126,738
Equity
Called up share capital 19 8,213 4,172 4,165
Share premium account 21 85,771 43,572 52,444
Own shares held 21 (15,841) (8,047) (8,198)
Additional paid-in capital 21 197,214 100,185 100,152
Capital redemption reserve 21 17,976 9,132 128
Accumulated other recognised income and expense 22 6,508 3,306 4,090
Retained losses 23 (167,820) (85,253) (67,356)
Total equity shareholders’ funds 132,021 67,067 85,425
Minority interests 445 226 (113)
Total equity 132,466 67,293 85,312
Non-current liabilities
Long term borrowings 24 35,035 17,798 16,750
Deferred tax liabilities 69,106 4,626 5,670
Post employment benefits 25 242 123 120
Provisions 26 583 296 265
Trade and other payables 27 1,053 535 566
46,019 23,378 23,371
Current liabilities
Short term borrowings:
Third parties 24 7,825 3,975 3,070
Related parties 24, 36 1,657 842 378
Current taxation liabilities 10,016 5,088 4,448
Trade and other payables 27 17,272 8,774 7,477
Provisions 26 525 267 139
37,295 18,946 15,512
Liabilities included in disposal group held for sale 29 ––2,543
Total equity and liabilities 215,780 109,617 126,738
The Consolidated Financial Statements were approved by the Board of directors on 29 May 2007 and were signed on its behalf by:
Arun Sarin Andy Halford
Chief Executive Chief Financial Officer
The accompanying notes are an integral part of these Consolidated Financial Statements.
The unaudited US dollar amounts are prepared on the basis set out in note 1.