Vodafone 2007 Annual Report Download - page 140
Download and view the complete annual report
Please find page 140 of the 2007 Vodafone annual report below. You can navigate through the pages in the report by either clicking on the pages listed below, or by using the keyword search tool below to find specific information within the annual report.-
 1
1 -
2
-
3
-
4
-
5
-
6
-
7
-
8
-
9
-
10
-
11
-
12
-
13
-
14
-
15
-
16
-
17
-
18
-
19
-
20
-
21
-
22
-
23
-
24
-
25
-
26
-
27
-
28
-
29
-
30
-
31
-
32
-
33
-
34
-
35
-
36
-
37
-
38
-
39
-
40
-
41
-
42
-
43
-
44
-
45
-
46
-
47
-
48
-
49
-
50
-
51
-
52
-
53
-
54
-
55
-
56
-
57
-
58
-
59
-
60
-
61
-
62
-
63
-
64
-
65
-
66
-
67
-
68
-
69
-
70
-
71
-
72
-
73
-
74
-
75
-
76
-
77
-
78
-
79
-
80
-
81
-
82
-
83
-
84
-
85
-
86
-
87
-
88
-
89
-
90
-
91
-
92
-
93
-
94
-
95
-
96
-
97
-
98
-
99
-
100
-
101
-
102
-
103
-
104
-
105
-
106
-
107
-
108
-
109
-
110
-
111
-
112
-
113
-
114
-
115
-
116
-
117
-
118
-
119
-
120
-
121
-
122
-
123
-
124
-
125
-
126
-
127
-
128
-
129
-
 130
130 -
 131
131 -
 132
132 -
 133
133 -
 134
134 -
 135
135 -
 136
136 -
 137
137 -
 138
138 -
 139
139 -
 140
140 -
 141
141 -
 142
142 -
 143
143 -
 144
144 -
 145
145 -
 146
146 -
 147
147 -
 148
148 -
 149
149 -
 150
150 -
151
-
152
-
153
-
154
-
155
-
156
-
157
-
158
-
159
-
160
-
161
-
162
-
163
-
164
 |
 |

138 Vodafone Group Plc Annual Report 2007
Notes to the Consolidated Financial Statements
continued
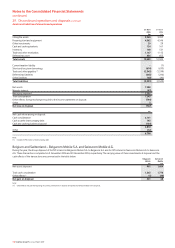
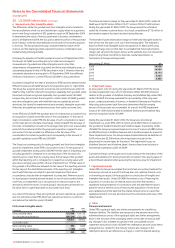
37. Financial information of joint ventures and associated undertakings continued
2007 2006 2005
50% or less owned entities classified as joint ventures £m £m £m
Revenue 6,515 4,919 3,946
Profit for the financial year 1,087 786 658
Non-current assets 4,171 7,631 2,983
Current assets 794 1,389 1,056
Total assets 4,965 9,020 4,039
Total equity shareholders’ funds 2,900 5,432 2,207
Minority interests 15 40 12
Total equity 2,915 5,472 2,219
Non-current liabilities 542 1,164 362
Current liabilities 1,508 2,384 1,458
Total liabilities 2,050 3,548 1,820
Total equity and liabilities 4,965 9,020 4,039
Summary aggregated financial information of Vodafone Omnitel N.V., extracted on a 100% basis from financial statements prepared under IFRS at 31 March
and for the years then ended, is set out below: 2007 2006 2005
£m £m £m
Revenue 5,522 5,619 5,518
(Loss)/profit for the financial year (3,369) (2,134) 1,507
Non-current assets 14,851 20,280 24,186
Current assets 4,780 2,837 6,117
Total assets 19,631 23,117 30,303
Total equity shareholders’ funds 17,054 21,124 28,272
Non-current liabilities 75 78 312
Current liabilities 2,502 1,915 1,719
Total liabilities 2,577 1,993 2,031
Total equity and liabilities 19,631 23,117 30,303
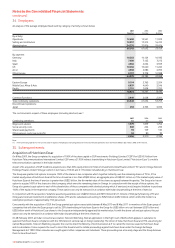
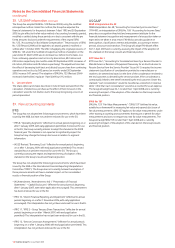
38. US GAAP information
The following is a summary of the effects of the differences between US GAAP and IFRS. The unaudited translation of pounds sterling amounts into US dollars
is provided solely for convenience based on the Noon Buying Rate on 30 March 2007 of $1.9685: £1.
Net loss for the years ended 31 March 2007 2007 2006 2005
Reference $m £m £m £m
Revenue (IFRS) 61,228 31,104 29,350 26,678
Items (decreasing)/increasing revenues:
Discontinued operations (61) (31) (944) (1,108)
Basis of consolidation a (12,268) (6,232) (5,756) (5,423)
Connection revenue b 1,020 518 1,106 1,223
Revenue (US GAAP) 49,919 25,359 23,756 21,370
(Loss)/profit for the financial year (IFRS) (10,427) (5,297) (21,821) 6,518
Items (increasing)/decreasing net loss:
Investments accounted for under the equity method c 1,339 680 (1,230) (5,440)
Connection revenue and costs b 10 5 10 16
Goodwill and other intangible assets d (26,283) (13,352) (14,299) (15,534)
Impairment losses e 13,189 6,700 15,377 475
Amortisation of capitalised interest f (211) (107) (108) (105)
Interest capitalised during the year f 102 52 36 19
Other g2,482 1,261 (42) 99
Income taxes h 11,539 5,862 8,902 6,680
Minority interests i (254) (129) (95) (108)
Cumulative effect of change in accounting principle: post employment benefits j –––(195)
Cumulative effect of change in accounting principle: intangible assets j –––(6,177)
Net loss (US GAAP) (8,514) (4,325) (13,270) (13,752)
Shareholders’ equity at 31 March
2007 2007 2006
Reference $m £m £m
Total equity (IFRS) 132,466 67,293 85,312
Items (decreasing)/increasing shareholders’ funds:
Investments accounted for under the equity method c (2,106) (1,070) (2,287)
Connection revenue and costs b ––(5)
Goodwill and other intangible assets d 50,226 25,515 32,552
Capitalised interest f2,642 1,342 1,443
Other g169 86 210
Income taxes h(43,029) (21,859) (30,354)
Minority interests i(445) (226) 113
Shareholders’ equity (US GAAP) 139,923 71,081 86,984