Vodafone 2007 Annual Report Download - page 36
Download and view the complete annual report
Please find page 36 of the 2007 Vodafone annual report below. You can navigate through the pages in the report by either clicking on the pages listed below, or by using the keyword search tool below to find specific information within the annual report.-
 1
1 -
2
-
3
-
4
-
5
-
6
-
7
-
8
-
9
-
10
-
11
-
12
-
13
-
14
-
15
-
16
-
17
-
18
-
19
-
20
-
21
-
22
-
23
-
24
-
25
-
 26
26 -
 27
27 -
 28
28 -
 29
29 -
 30
30 -
 31
31 -
 32
32 -
 33
33 -
 34
34 -
 35
35 -
 36
36 -
 37
37 -
 38
38 -
 39
39 -
 40
40 -
 41
41 -
 42
42 -
 43
43 -
 44
44 -
 45
45 -
 46
46 -
47
-
48
-
49
-
50
-
51
-
52
-
53
-
54
-
55
-
56
-
57
-
58
-
59
-
60
-
61
-
62
-
63
-
64
-
65
-
66
-
67
-
68
-
69
-
70
-
71
-
72
-
73
-
74
-
75
-
76
-
77
-
78
-
79
-
80
-
81
-
82
-
83
-
84
-
85
-
86
-
87
-
88
-
89
-
90
-
91
-
92
-
93
-
94
-
95
-
96
-
97
-
98
-
99
-
100
-
101
-
102
-
103
-
104
-
105
-
106
-
107
-
108
-
109
-
110
-
111
-
112
-
113
-
114
-
115
-
116
-
117
-
118
-
119
-
120
-
121
-
122
-
123
-
124
-
125
-
126
-
127
-
128
-
129
-
130
-
131
-
132
-
133
-
134
-
135
-
136
-
137
-
138
-
139
-
140
-
141
-
142
-
143
-
144
-
145
-
146
-
147
-
148
-
149
-
150
-
151
-
152
-
153
-
154
-
155
-
156
-
157
-
158
-
159
-
160
-
161
-
162
-
163
-
164
 |
 |

34 Vodafone Group Plc Annual Report 2007
Operating Results
Revenue
Revenue increased by 6.0% to £31,104 million in the year to 31 March
2007, with organic growth of 4.3%. The net impact of acquisitions and
disposals contributed 3.3 percentage points to revenue growth, offset by
unfavourable movements in exchange rates of 1.6 percentage points, with
both effects arising principally in the EMAPA region.
The Europe region recorded organic revenue growth of 1.4%, whilst the
EMAPA region delivered organic revenue growth of 21.1%. As a result, the
EMAPA region accounted for more than 70% of the organic growth in Group
revenue. Strong performances were recorded in Spain and a number of the
Group’s emerging markets.
An increase in the average mobile customer base and usage stimulation
initiatives resulted in organic revenue growth of 2.5% and 7.0% in voice and
messaging revenue, respectively. Data revenue is an increasingly important
component of Group revenue, with organic growth of 30.7%, driven by
increasing penetration from 3G devices and growth in revenue from
business services.
The Europe region and common functions contributed 79% of Group
revenue, of which approximately 63% was euro denominated, with the
remaining 16% being denominated in sterling. The remaining 21% was
generated in the EMAPA region where no single currency was individually
significant.
This section presents detail of the Group’s operating performance for the 2007 financial year versus the 2006
financial year and for the 2006 financial year versus the 2005 financial year, providing understanding of how the
revenue and the adjusted operating profit performance of the Group and its operating segments within the
Europe and EMAPA regions have developed in the last three years.
During the year ended 31 March 2007, the Group changed the organisational structure of its operations. The
following results are presented for continuing operations in accordance with the new organisational structure.
Europe includes the results of the Group’s mobile operations in Western Europe and its fixed line business in
Germany, while EMAPA includes the Group’s operations in Eastern Europe, the Middle East, Africa and Asia and
the Pacific area and the Group’s associates and investments.
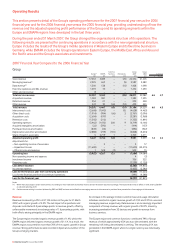
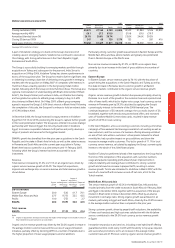
2007 Financial Year Compared to the 2006 Financial Year
Group Common Group Group
Europe(1) EMAPA Functions Eliminations 2007 2006 % change
£m £m £m £m £m £m £ Organic
Voice revenue 17,357 5,089 −(70) 22,376 21,405
Messaging revenue(2) 2,925 667 −(5) 3,587 3,289
Data revenue(2) 1,300 138 −(10) 1,428 1,098
Fixed line operators and DSL revenue 1,397 75 −−1,472 1,290
Other service revenue 8 −− − 8−
Total service revenue 22,987 5,969 – (85) 28,871 27,082 6.6 4.7
Acquisition revenue 1,004 381 −−1,385 1,295
Retention revenue 354 21 −−375 448
Other revenue 247 70 168 (12) 473 525
Total revenue 24,592 6,441 168 (97) 31,104 29,350 6.0 4.3
Interconnect costs (3,668) (1,045) −85 (4,628) (4,463)
Other direct costs (1,914) (784) (66) 3 (2,761) (2,096)
Acquisition costs (2,604) (677) −−(3,281) (2,968)
Retention costs (1,543) (212) −−(1,755) (1,891)
Operating expenses (5,462) (1,472) 206 9 (6,719) (6,166)
Acquired intangibles amortisation (22) (392) −−(414) (157)
Purchased licence amortisation (849) (43) −−(892) (947)
Depreciation and other amortisation (2,888) (779) (181) −(3,848) (3,674)
Share of result in associates 5 2,719 1 −2,725 2,411
Adjusted operating profit 5,647 3,756 128 – 9,531 9,399 1.4 4.2
Adjustments for:
– Non-operating income of associates −3−−317
– Impairment losses (11,600) −− −(11,600) (23,515)
– Other income and expense 1 508 (7) −502 15
Operating loss (5,952) 4,267 121 – (1,564) (14,084)
Non-operating income and expense 4 (2)
Investment income 756 353
Financing costs (1,579) (1,120)
Loss before taxation (2,383) (14,853)
Income tax expense (2,423) (2,380)
Loss for the financial year from continuing operations (4,806) (17,233)
Loss for the financial year from discontinued operations (491) (4,588)
Loss for the financial year (5,297) (21,821)
Notes:
(1) Within the Europe region, certain revenue and costs relating to Arcor have been reclassified. All prior periods have been adjusted accordingly. The reclassification had no effect on total revenue, EBITDA
or adjusted operating profit.
(2) Certain revenue relating to content delivered by SMS and MMS has been reclassified from messaging revenue to data revenue to provide a fairer presentation of messaging and data revenue.